S&P 500 Forecast This Week — Outlook, Drivers & Key Levels
This week's S&P 500 outlook: key drivers, volatility context, risk-opportunity assessment and the week ahead.

Where Things Stand
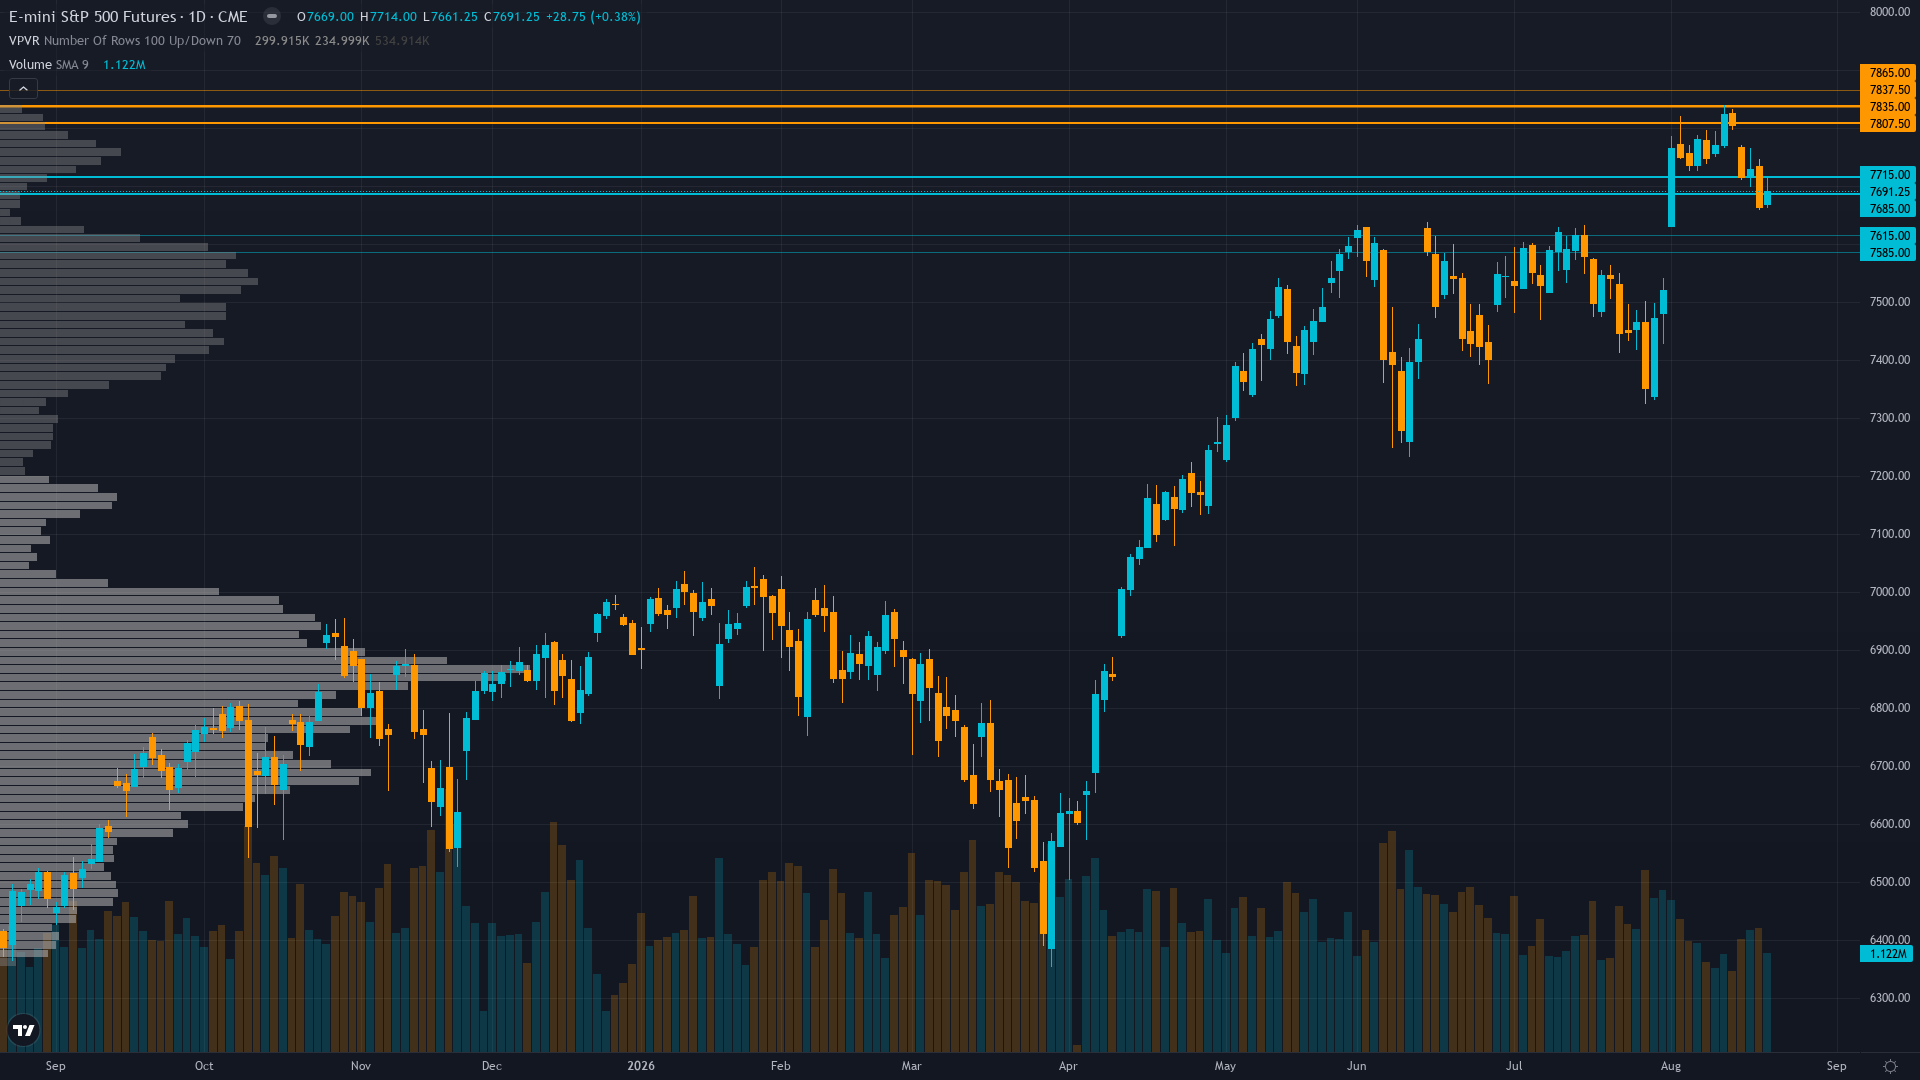
S&P 500 is trading at 7691.25, up a modest 0.38% as the market edges higher. S&P 500 futures is consolidating, with price compressing into a narrower range as the market builds energy for its next move.
Cautiously expecting a bounce from 7,690 support ahead of Jackson Hole, but reduced conviction after last week's failed breakout from 7,822.5 ATH with Core PCE and Warsh speech creating binary two-week catalyst window
What's Driving Price
Primary driver: ES pulled back -1.46% from 7,805 to 7,691 last week after failing at 7,822.5 all-time high resistance, with the uptrend structure intact above 7,690 support but momentum decaying ahead of Jackson Hole Aug 27-29 and Core PCE Aug 26 binary catalysts
Secondary factor: CFTC COT data Aug 18 reveals non-commercial net position flipped from +11,280 long two weeks ago to -10,560 short (85.4th percentile of 3-year range) — a -21,840 contract swing in one week creating extreme bearish speculative positioning that sets up short-covering squeeze potential on any positive catalyst
Additional influence: Three hawkish FOMC dissents in July (Hammack, Kashkari, Logan) and September rate hike odds at ~33% create policy uncertainty into Warsh's first Jackson Hole speech as Fed Chair on Aug 28, with markets parsing whether he leans into the AI disinflation thesis or acknowledges hawkish internal pressure
Economic backdrop: Fed on hold at 3.63%, inflation stable at 2.34%, unemployment 4.1%, Core PCE Jul due Aug 26 (est 0.2% MoM) is the next inflation catalyst — any upside surprise could challenge the stable inflation narrative ahead of Jackson Hole
Fundamental assessment: Forward P/E 20.0x moderately overvalued versus historical averages but supported by projected Q3/Q4 2026 earnings growth of 27.4%/25.2% (FactSet Aug 7) — valuation compression risk exists if earnings fail to materialize
Chart Assessment
Daily uptrend intact with ES at 7,691 above 50-day and 200-day MAs but RSI declining toward 50 from overbought after rejection at 7,822.5 ATH — 7,690-7,700 zone is the critical short-term support that, if broken, opens test of 7,500-7,600
With trend strength at 6/10, there's a clear directional tilt but room for the move to develop further.
Risk & Opportunity
Primary risk: Thesis health degraded after -1.46% pullback from ATH in a BULLISH week — further breakdown below 7,650 support would confirm failed breakout and open test of 7,500-7,600 zone as momentum shifts from uptrend to distribution (Probability: medium)
Primary opportunity: Extreme bearish COT positioning at 85.4th percentile after 21,840-contract flip in one week sets up asymmetric short-covering rally — any positive catalyst (dovish Warsh Jackson Hole speech, soft Core PCE) could trigger violent squeeze back toward 7,800-7,822 (Timeframe: August 26-29 2026)
This week's edge: Thesis health degraded — insufficient evidence for directional call after -1.46% pullback while BULLISH. The market may be underestimating the speed and extremity of the CFTC speculative positioning flip from net long +11,280 to net short -10,560 at 85.4th percentile in just two weeks, creating powerful short-covering squeeze potential on any positive Jackson Hole catalyst, while simultaneously overpricing the probability of a hawkish Warsh speech given his AI disinflation thesis may dominate over the three dissent votes
Volatility Backdrop
ES futures sits in a low-volatility regime (35th percentile), where the calm surface often masks building pressure. Volatility remains anchored at current levels, with no clear signal of an imminent regime shift in either direction.
Low volatility regime suggests 0.5-1.0% daily ES moves (~40-80 points range) — current VIX 15.87 prices ~0.95% one-standard-deviation daily moves; support at 7,650-7,690 and resistance at 7,775-7,800 define the consolidation zone ahead of binary catalysts
The Week Ahead
Core PCE Price Index MoM (Jul) — estimate 0.2% vs previous 0.1% — key inflation data ahead of Warsh's Jackson Hole debut speech Aug 28 on Wednesday 26 August is a high-impact catalyst with the potential to redefine the near-term outlook entirely.
How S&P 500 navigates the confluence of consolidating conditions and incoming data will determine whether the current directional thesis holds or breaks.
This analysis covers one dimension. Our full weekly report combines six specialist agents into a single actionable briefing with directional bias, key levels, and risk-opportunity matrix.
Start Free — Get the Market of the WeekFree weekly report · No credit card · Upgrade anytime



