S&P 500 Forecast This Week — Outlook, Drivers & Key Levels
This week's S&P 500 outlook: key drivers, volatility context, risk-opportunity assessment and the week ahead.

Where Things Stand
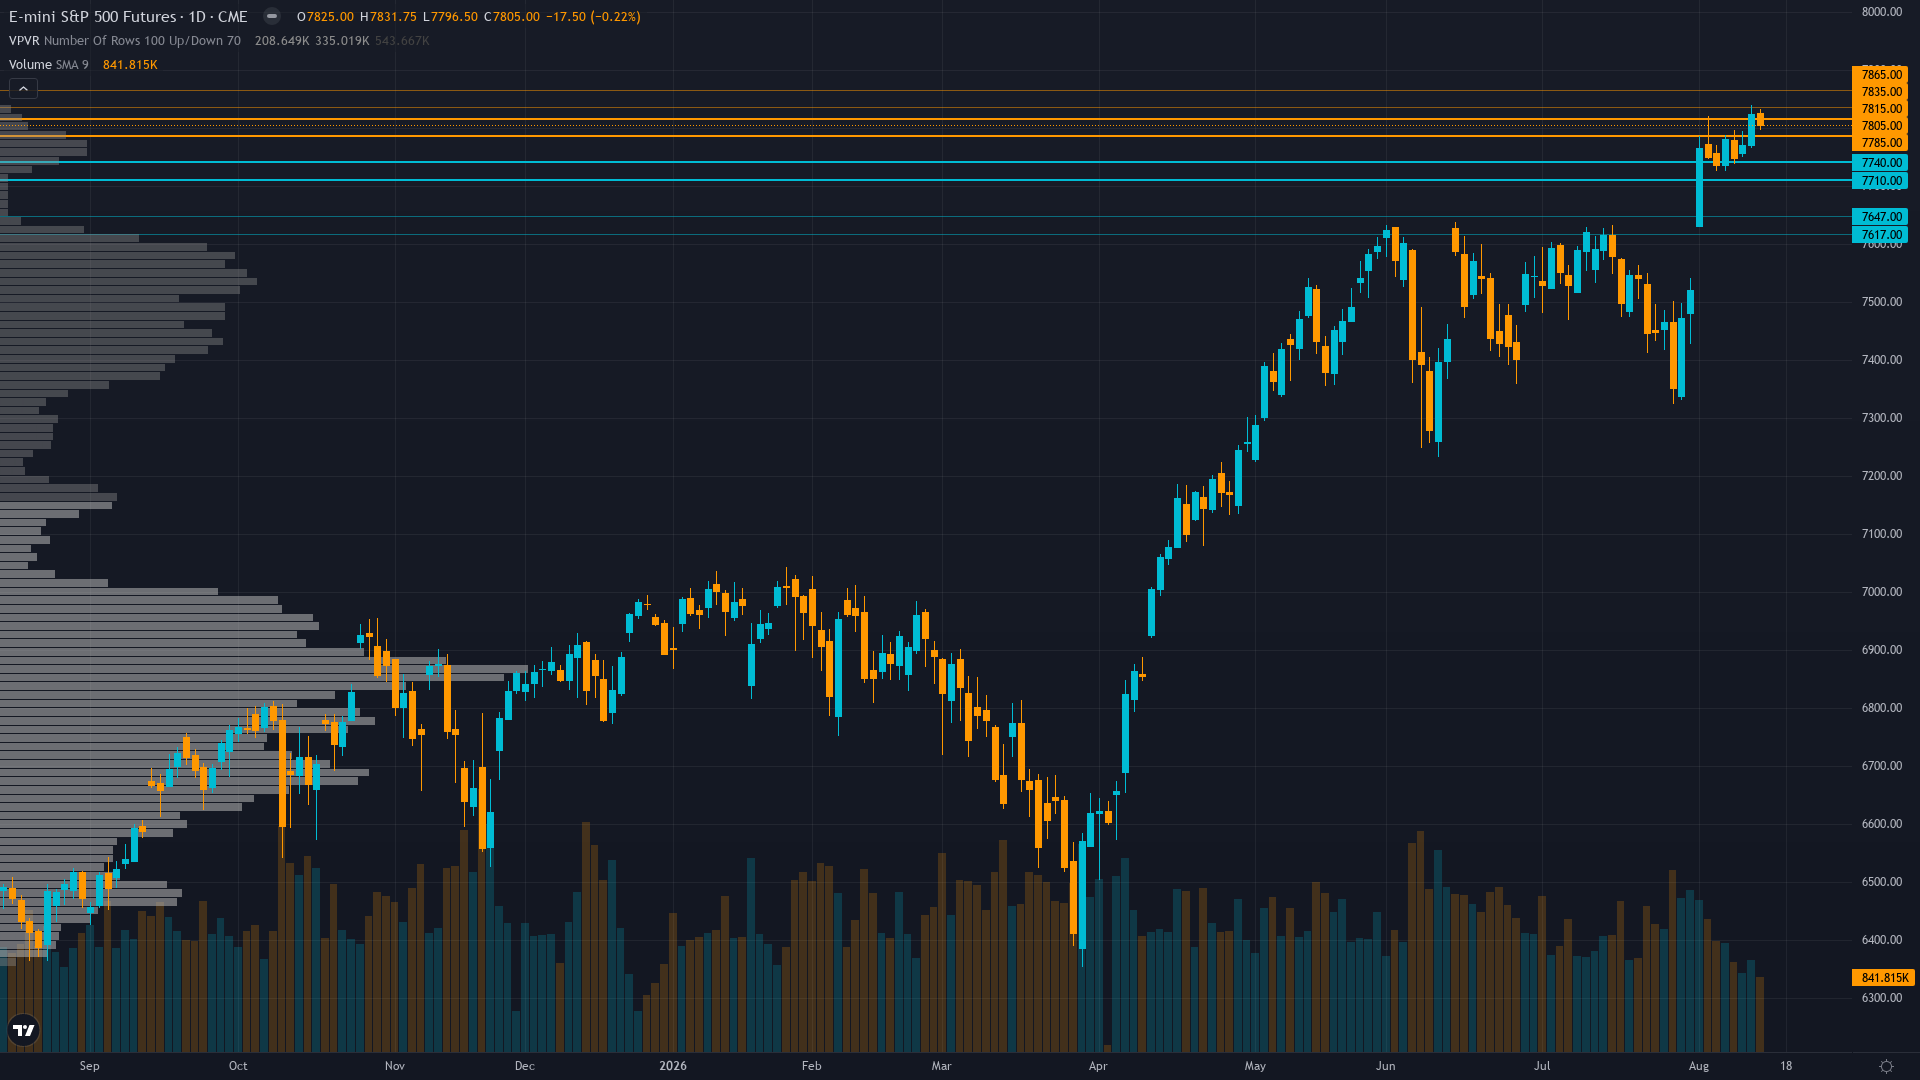
S&P 500 sits at 7805 after slipping 0.22% — a shallow pullback rather than a decisive move. S&P 500 futures is in a trending up market state, requiring careful assessment of current conditions.
Broadly bullish after third straight weekly gain driven by AI capex cycle and VIX compression to new lows, with S&P 500 near record highs supported by controlled inflation and earnings strength, though August seasonal weakness and overbought conditions create caution ahead of Housing Starts/Industrial Production data Aug 18 and Jackson Hole Aug 27-29
What's Driving Price
Primary driver: ES at 7,805 near all-time high 7,822.5 after third straight weekly gain (+0.32% week to Aug 14) in sustained uptrend driven by AI capex cycle ($725B hyperscaler spending in 2026) and VIX compression to 14.25-14.6 new 2026 lows reflecting extreme complacency as market ignores August-September seasonal headwinds heading into critical Jackson Hole catalyst Aug 27-29
Secondary factor: CFTC COT data August 11 reveals non-commercial net long surged +38,538 contracts to +11,280 at 90.5th percentile of 3-year range — speculative positioning now approaching extreme territory after flipping from -27,258 net short three weeks ago, creating mean-reversion risk as extended longs have less fuel while corporate buyback blackout period from Q2 earnings removes key institutional demand support
Additional influence: Macro backdrop remains supportive with inflation at 2.27% (Aug 14) stable, Fed on hold at 3.63%, VIX at 14.25-14.6 new 2026 lows, HY OAS at 271bps tight, and USD weakening (-0.84% MoM) — but retail sales dipped to $660B (July 1) from $665B, consumer sentiment at 49.5 (June) remains depressed, and upcoming Housing Starts/Industrial Production (Aug 18) could challenge the soft-landing narrative if data disappoints
Economic backdrop: Inflation at 2.27% stable, unemployment 4.1%, Fed on hold at 3.63% with JPMorgan expecting no cuts through 2026; retail sales dipping and consumer sentiment at 49.5 (depressed) create mixed signals while Jackson Hole Aug 27-29 represents next major policy catalyst for forward guidance
Fundamental assessment: Forward P/E 20.0x moderately overvalued 5-10% above historical average but supported by Q2 2026 earnings growth of 50.4% (FactSet Aug 7) and 30% full-year consensus — earnings trajectory remains robust though upside surprises already priced, creating execution risk for Q3 reports beginning October
Chart Assessment
Daily uptrend intact with ES at 7,805 above 50-day (~7,600) and 200-day (~7,400) MAs, but price compressing into 7,801 major call wall resistance and 7,822.5 all-time high — RSI likely overbought >70 with volume thinning near resistance suggesting exhaustion risk rather than breakout energy
Trend strength registers 8/10 — a reading that suggests the directional impulse has real staying power.
Volatility Context
At the 22th percentile, ES futures volatility is unusually subdued, creating conditions that historically precede sharp directional moves. Realised vol is declining steadily, compressing into ranges that tend to snap when a catalyst breaks the equilibrium.
Low volatility regime suggests 0.5-1.0% daily ES moves — current VIX 14.25 prices ~0.9% one-standard-deviation daily moves; ES futures traded 7,796.50-7,831.75 intraday range Aug 14 confirming tight consolidation near ATH resistance; breakout or breakdown from 7,822.5 level expected to produce 1.5-2.5% directional expansion
Upside & Downside
Primary risk: Failure to break above 7,822.5 ATH resistance after third weekly gain could trigger profit-taking from overbought RSI conditions and extreme speculative long positioning at 90.5th percentile — a 2-3% pullback toward 7,600-7,650 on weak economic data (Housing Starts/Industrial Production Aug 18) would expose crowded speculative longs to stop-loss cascades in thin August liquidity (Probability: medium)
Primary opportunity: Housing Starts and Industrial Production (Aug 18) beat estimates confirming economic resilience, enabling ES breakout above 7,822.5 ATH to test 7,850-7,900 as VIX compresses below 14 and the 3-year COT positioning at 90.5th percentile creates short-covering fuel from remaining bears during sustained uptrend momentum (Timeframe: August 17-25 2026)
This week's edge: Market is underappreciating the speed and extremity of the CFTC speculative positioning flip — from net short -27,258 to net long +11,280 at 90.5th percentile in just three weeks — creating a fragile long base that provides limited marginal buying power and elevated stop-loss cascade risk on any negative catalyst, while simultaneously overestimating the sustainability of VIX compression to 14.25 (new 2026 lows) given August-September seasonal volatility patterns and the approaching Jackson Hole symposium where Fed forward guidance could reintroduce policy uncertainty that markets have complacently priced out
The Week Ahead
The NY Empire State Manufacturing Index (Aug) — consensus 10.2 vs prior 15.6 — first read on August manufacturing activity; followed by Housing Starts (Jul) Aug 18 and Industrial Production (Jul) Aug 18 on Monday 17 August represents a mid-tier catalyst that could accelerate or stall the current directional thesis.
How S&P 500 navigates the confluence of trending up conditions and incoming data will determine whether the current directional thesis holds or breaks.
This analysis covers one dimension. Our full weekly report combines six specialist agents into a single actionable briefing with directional bias, key levels, and risk-opportunity matrix.
Start Free — Get the Market of the WeekFree weekly report · No credit card · Upgrade anytime



