S&P 500 Forecast This Week — Outlook, Drivers & Key Levels
This week's S&P 500 outlook: key drivers, volatility context, risk-opportunity assessment and the week ahead.

Where Things Stand
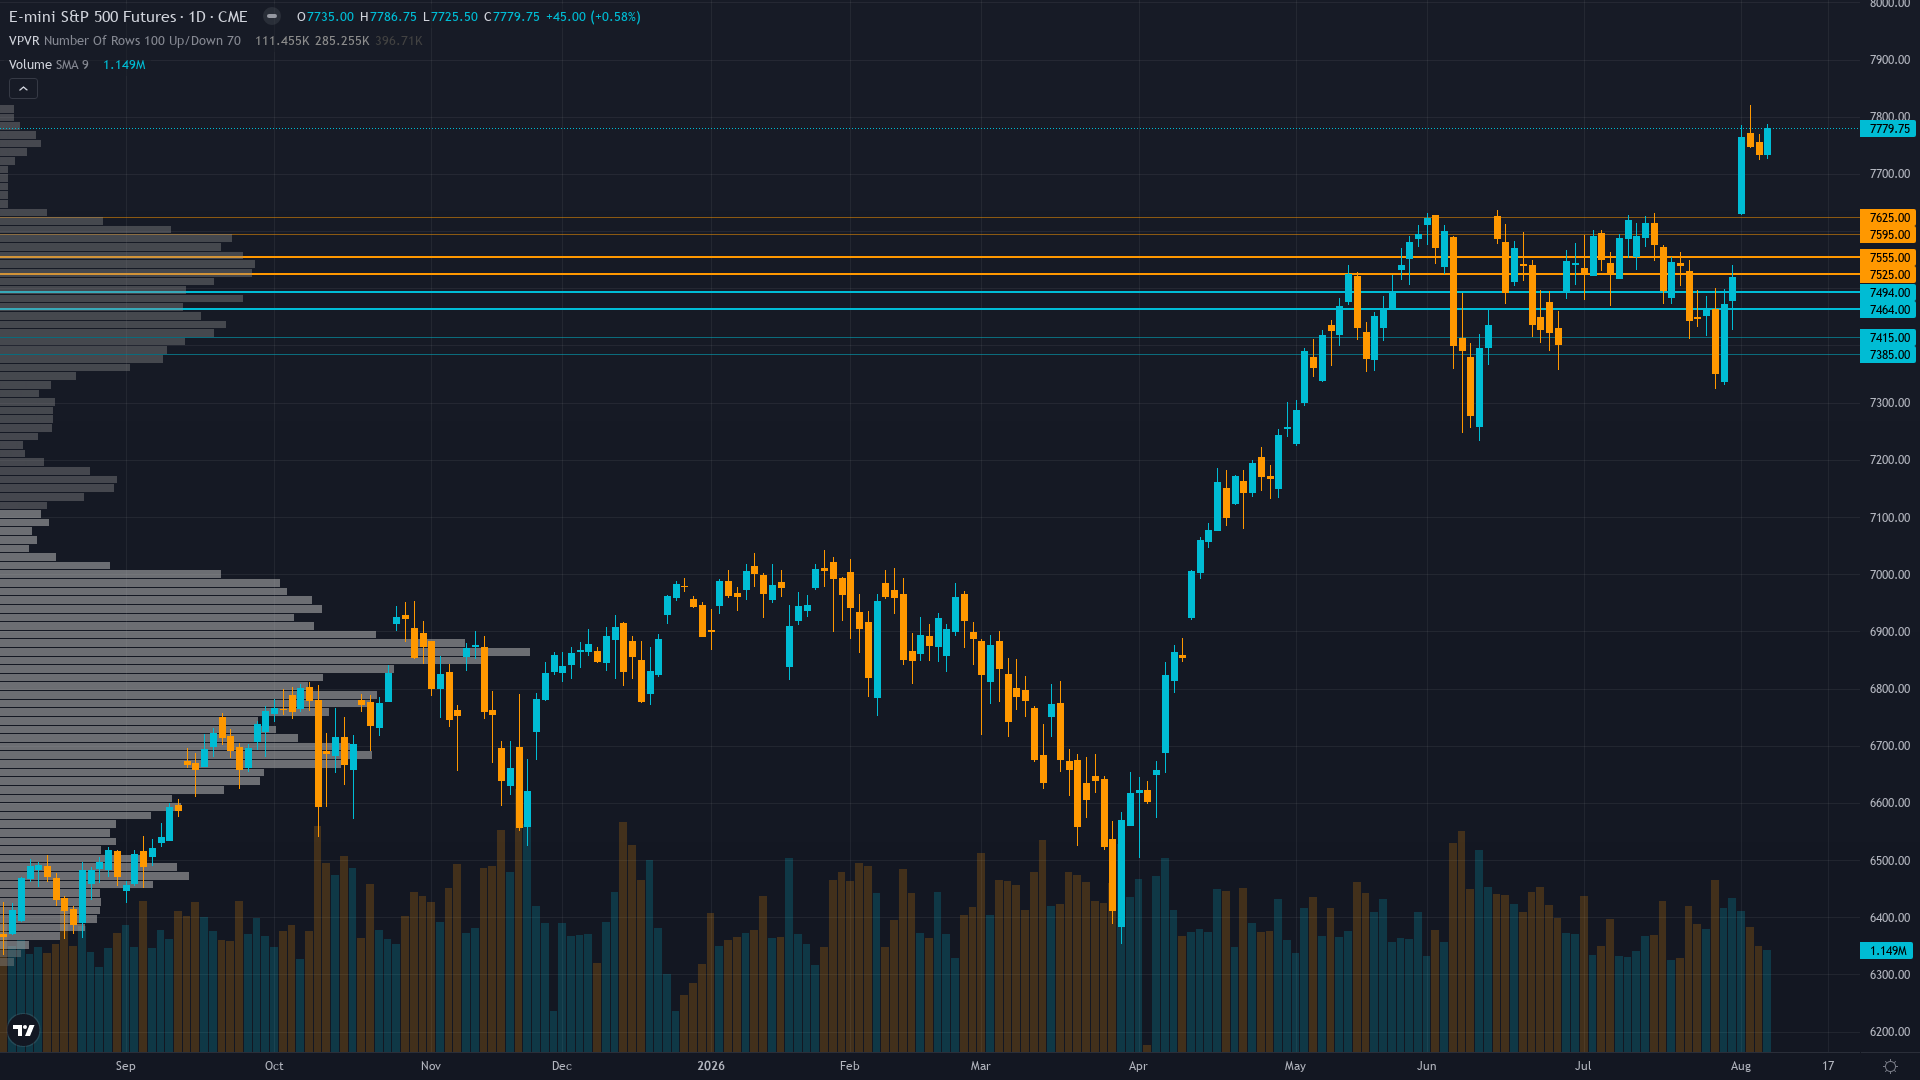
Trading at 7779.75 with a 0.58% uptick, S&P 500 is drifting higher without strong conviction. S&P 500 futures is in a trending up market state, requiring careful assessment of current conditions.
Broadly bullish after July NFP shock -23K print broke multi-month consolidation, S&P 500 at fresh all-time highs with strong earnings support and rate cut expectations accelerating, though August seasonal weakness and overbought conditions create caution ahead of August 12 CPI catalyst
What's Driving Price
Primary driver: July NFP shock decline of -23K jobs on August 7 vs +86K expected guts September Fed hike odds, triggering S&P 500 to new all-time high breakout above 7,700 in best weekly performance (+3.46%) since April as rate cut expectations accelerate and AI capex cycle momentum extends
Secondary factor: Technical breakout confirmed with ES at 7779.75 above both 50-day MA (~7500) and 200-day MA (~7200), well above prior resistance 7,540-7,600, RSI overbought >70 but uptrend channel intact with 1.15M volume supporting move to fresh ATH as multi-month consolidation resolves higher
Additional influence: CPI July release on August 12 (3 days away) represents the next binary catalyst with consensus 3.4% YoY vs prior 3.5% — a below-consensus print would cement rate cut expectations while an upside surprise above 3.5% could challenge the risk-on narrative that powered this week's rally
Economic backdrop: Fed funds stable at 3.63% with July NFP -23K shock gutting September hike odds, inflation at 2.25% trending toward target, 10Y yield -10bp this week to 4.65% supporting equity multiples, CPI August 12 next binary catalyst
Fundamental assessment: Forward P/E 20.0x slightly above 5-year avg 19.9x, Q2 2026 earnings growth 50.4% exceptional, fairly valued to moderately overvalued by 5-10% but strong earnings trajectory supports current levels
Chart Assessment
Clean uptrend channel with ES at fresh all-time high 7779.75 above both 50-day and 200-day MAs, RSI overbought >70 suggesting near-term pullback risk but uptrend structure intact with volume confirming breakout
Trend strength registers 8/10 — a reading that suggests the directional impulse has real staying power.
Risk & Opportunity
Primary risk: CPI July (August 12) prints above 3.5% YoY, challenging disinflation narrative and reigniting Fed hawkish expectations, triggering profit-taking from overbought conditions (RSI >70) and testing 7,725 immediate support as VIX re-expands from compressed 15.15 level (Probability: medium)
Primary opportunity: CPI July prints below 3.4% YoY confirming disinflation trend, cementing Fed cut expectations and enabling ES breakout above 7,800 toward 7,850-8,000 as short covering from -27,258 net short speculative positioning accelerates and VIX compresses below 14 (Timeframe: August 12-19 2026)
This week's edge: Market may be underestimating the short squeeze potential from CFTC non-commercial net short positioning at -27,258 contracts at 80.4th percentile of 3-year range — continued rally would force covering, while overestimating the sustainability of complacent VIX 15.15 at ATHs where any CPI upside surprise could trigger sharp mean-reversion in a market that just repriced rate expectations aggressively after the NFP miss
Volatility Backdrop
ES futures volatility at the 45th percentile reflects a balanced environment where standard risk parameters apply. Volatility contraction continues, building the stored energy that typically precedes the next significant directional move.
Normal volatility regime suggests 1.0-1.5% daily ES moves expected with current breakout from 7,500-7,540 consolidation representing 3.5% week — August 12 CPI binary outcome presents asymmetric expansion risk with potential 1.5-2.5% intraday swings on inflation surprise either direction while 7,800 round number creates technical decision point
The Week Ahead
July CPI YoY release at 12:30 ET — consensus 3.4% vs prior 3.5% — this will test whether disinflation trend continues and validate or challenge the rate cut expectations that powered this week's record rally on Wednesday 12 August is a high-impact catalyst with the potential to redefine the near-term outlook entirely.
How S&P 500 navigates the confluence of trending up conditions and incoming data will determine whether the current directional thesis holds or breaks.
This analysis covers one dimension. Our full weekly report combines six specialist agents into a single actionable briefing with directional bias, key levels, and risk-opportunity matrix.
Start Free — Get the Market of the WeekFree weekly report · No credit card · Upgrade anytime



