S&P 500 Forecast This Week — Outlook, Drivers & Key Levels
This week's S&P 500 outlook: key drivers, volatility context, risk-opportunity assessment and the week ahead.

This Week's Starting Point
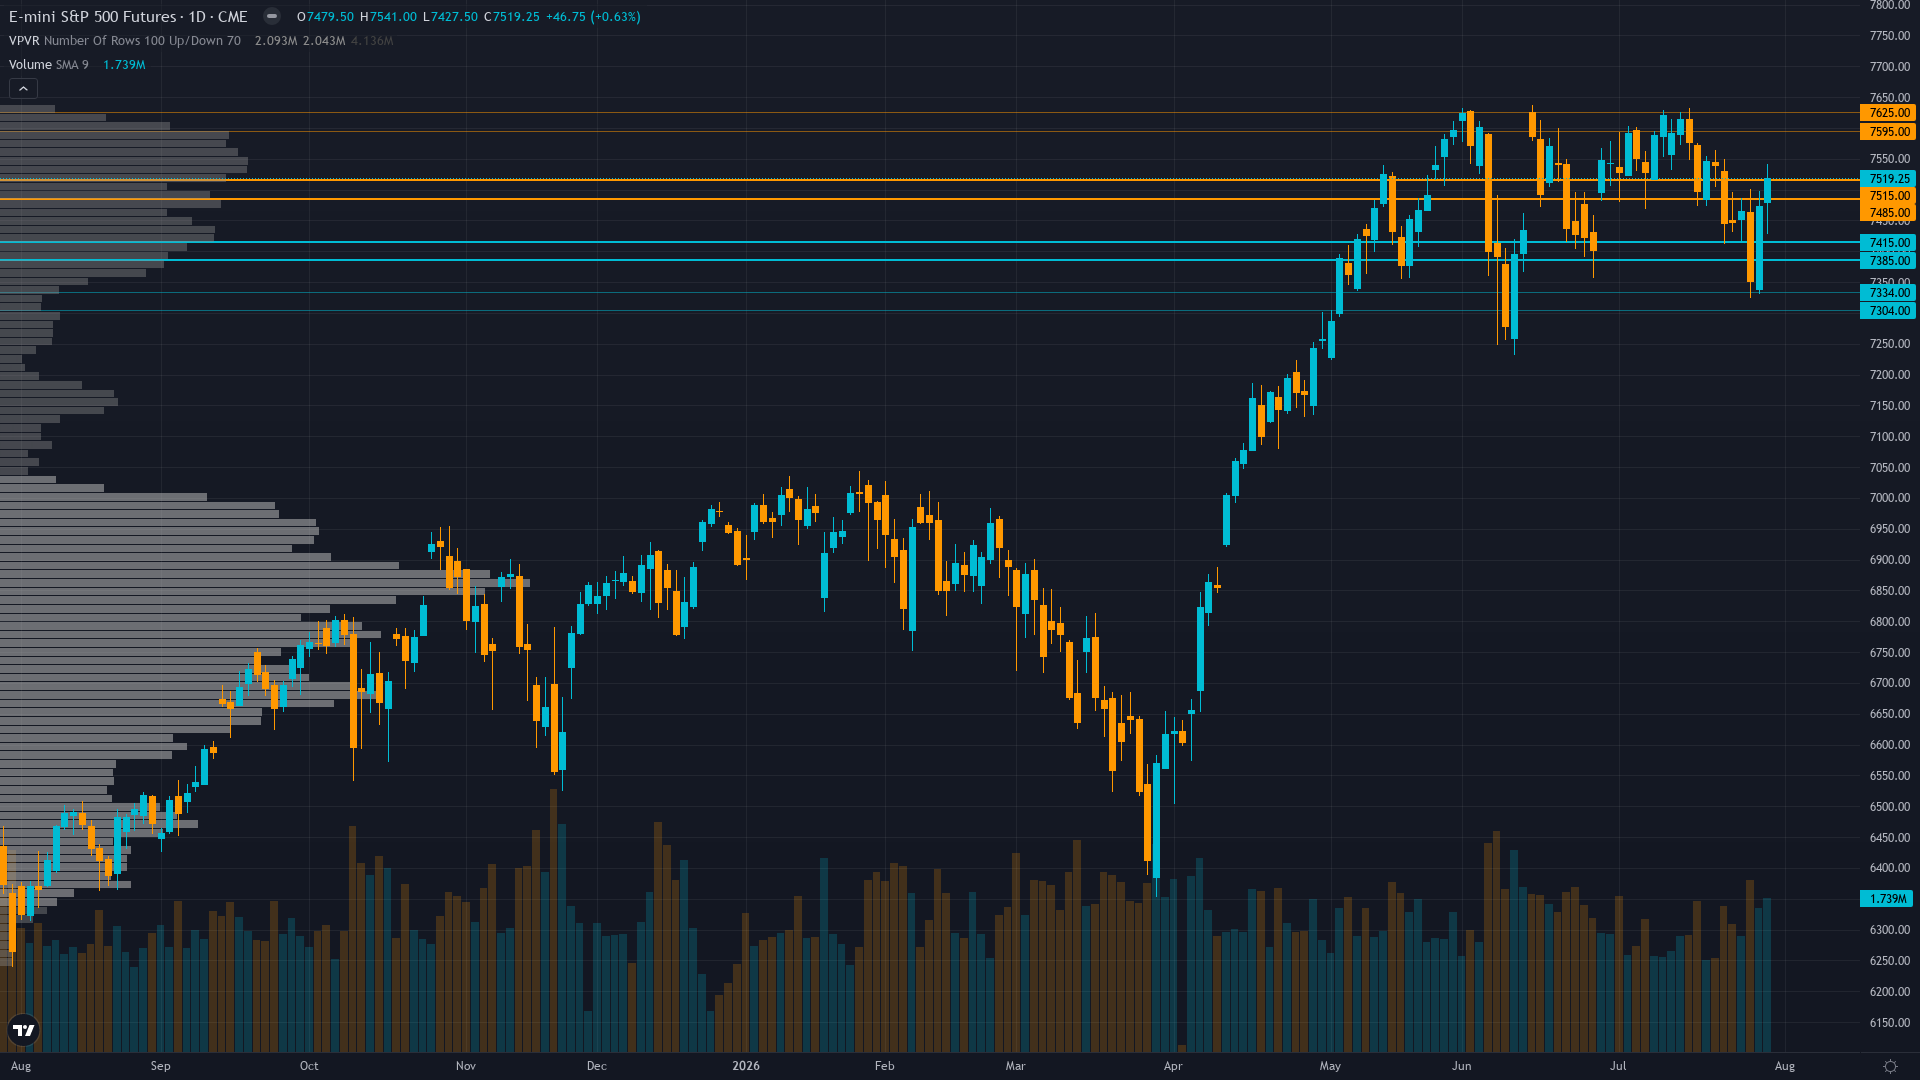
At 7519.25, S&P 500 has inched 0.53% higher in a measured advance. Price action in S&P 500 futures has compressed into a consolidation pattern, typically a precursor to a directional breakout.
Cautiously bullish after FOMC relief rally resolved July technical breakdown, with ES recovering above both 50-day and 200-day MAs but sellers defending 7,540-7,600 resistance ahead of August 7 NFP as the next catalyst for directional resolution
Forces in Play
Primary driver: Post-FOMC relief rally digested as ES recovers from 7,447 to 7,519 following July 29 hold decision with three dissents, but 7,540-7,600 resistance cluster caps upside ahead of August 7 NFP catalyst with no fresh earnings or macro catalyst this week
Secondary factor: July 29 FOMC held rates at 3.50-3.75% (fifth consecutive hold) but three officials dissented for the first time since 2014, creating hawkish undercurrent beneath Chair Warsh's market-soothing press conference that triggered 1.7% S&P 500 rally day and recovery above both 50-day and 200-day MAs
Additional influence: August seasonal effects begin with historically decent 65% positive close rate and 0.3% average monthly gain, but Schaeffer's flags approaching bearish seasonality window (Aug-Oct weaker period) as S&P 500 sits up 8.5% YTD without fresh fundamental catalyst to drive new highs
Economic backdrop: Fed held at 3.50-3.75% with growing hawkish dissent (3 officials) but Warsh's accommodative press conference maintains status quo, June NFP 57K big miss vs 110K expected sets low bar for August 7 report, ISM manufacturing expansion continues supporting soft landing thesis
Fundamental assessment: Forward PE 20.92x moderately overvalued but supported by Q2 2026 exceptional 47.4% earnings growth and 88% beat rate, though Q2 earnings season concluded in late July with results already priced in and no new fundamental catalyst until Q3 earnings begin in October
Technical Landscape
ES at 7,519 recovered above 50-day MA (7,506) and 200-day MA (7,479) after late-July breakdown was reversed by FOMC relief rally, but price now compressing into 7,500-7,540 resistance zone from prior consolidation with RSI 52.49 neutral and no breakout catalyst to drive continuation above 7,540
Trend strength sits at 5/10, reflecting moderate directional pressure without clear dominance.
Risk-Reward Assessment
Primary risk: NFP on August 7 delivers strong beat (150K+ jobs) following June's 57K miss, reigniting hawkish FOMC dissent narrative and triggering equity multiple compression from forward PE 20.92x as VIX expands from compressed 16.00 level, testing 7,400 support and invalidating the post-FOMC relief rally structure (Probability: medium)
Primary opportunity: NFP delivers another weak print (below 100K) confirming labor market softening, accelerating rate cut expectations for September FOMC and enabling ES breakout above 7,540-7,600 resistance toward 7,650-7,700 as VIX compresses below 15 and post-FOMC bullish momentum extends (Timeframe: August 7-14 2026)
This week's edge: Signal below Min Signal 1.0 threshold requires NO CALL per Rule 2 — directional edge insufficient despite post-FOMC relief. Market may be underestimating significance of three FOMC dissents creating structural hawkish risk for September meeting that contradicts the accommodative surface, while overestimating the sustainability of the post-FOMC rally given 7,540 resistance unbreached, no fresh earnings catalyst until October, and compressed VIX 16.00 creating asymmetric vulnerability to August NFP surprise
Risk Environment
With vol at the 42th percentile over 90 days, ES futures is in a measured regime that doesn't require unusual adjustments. Volatility is contracting, with realised vol declining across timeframes. Compressed volatility often precedes sharp directional moves as energy builds.
Normal volatility regime suggests 1.0-1.5% daily ES moves expected with current 7,427-7,541 intraday range representing 1.5% width — August 7 NFP binary outcome presents asymmetric expansion risk with potential 1.5-2.5% intraday swings on jobs surprise either direction while 7,540 resistance creates technical decision point
Looking Forward
All eyes turn to July Nonfarm Payrolls report at 8:30 AM ET — critical after June's catastrophic miss of 57K vs 110K expected; a strong print would reignite rate hike fears and hawkish dissent, while another weak print could accelerate rate cut pricing and lift equities on Friday 7 August, which carries enough weight to force a decisive directional move.
The week ahead for S&P 500 futures hinges on whether the prevailing consolidating regime can absorb the scheduled catalysts without a regime shift.
This analysis covers one dimension. Our full weekly report combines six specialist agents into a single actionable briefing with directional bias, key levels, and risk-opportunity matrix.
Start Free — Get the Market of the WeekFree weekly report · No credit card · Upgrade anytime



