S&P 500 Forecast This Week — Outlook, Drivers & Key Levels
This week's S&P 500 outlook: key drivers, volatility context, risk-opportunity assessment and the week ahead.

This Week's Starting Point
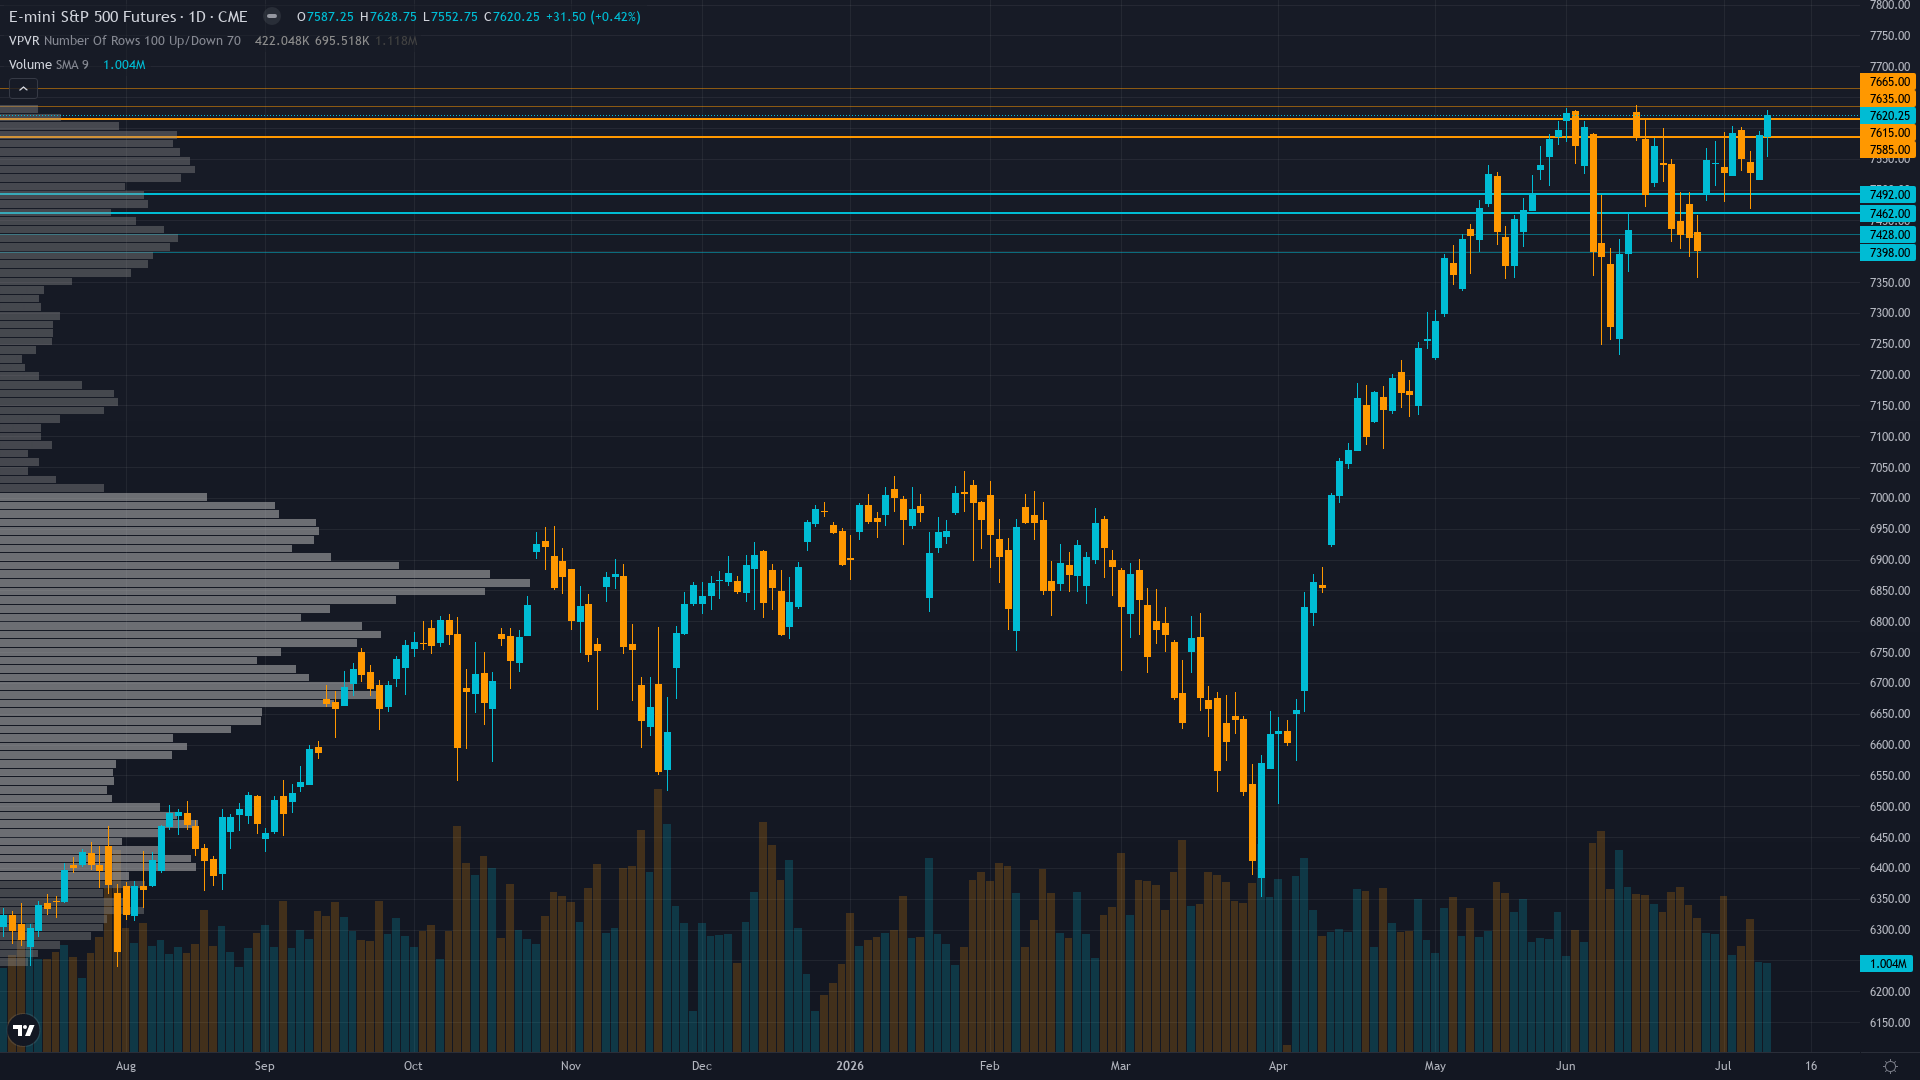
S&P 500 holds at 7620.25, up a marginal 0.42% as the market grinds forward. Price action in S&P 500 futures has compressed into a consolidation pattern, typically a precursor to a directional breakout.
Cautiously bullish on Q2 earnings strength and technical momentum above key moving averages, expecting Monday July 13 financial sector reports to validate 23.3% growth trajectory enabling grind toward 7,650-7,700 resistance, yet increasingly aware breadth deterioration and put/call 0.55 complacency create asymmetric downside risk if guidance disappoints
Forces in Play
Primary driver: Q2 2026 earnings season begins Monday July 13 with major financials testing 23.3% growth expectations upgraded 4.5pp during quarter itself, as ES consolidates at 7,620 just below 7,650 resistance with FactSet reporting 89% beat rate through July 10 from 18 companies validating exceptional fundamental trajectory
Secondary factor: VIX compression to 15.03 from July 10 (down from 18.43 week prior) marks 52% decline from March 31.05 extreme creating calm surface, yet equity put/call 0.55 shows minimal hedging activity despite proximity to all-time highs while breadth deterioration to 41.3% advancing versus 57.7% declining signals narrowing rally structure creating fragility
Additional influence: Technical momentum intact with ES at 7,620 above 50-day MA 7,509 (+1.5%) and 200-day MA 7,472 (+2.0%) with RSI 66.17 healthy bullish yet July's 11-year winning streak (2015-2025) through July 8 down -0.22% creates behavioral anchoring risk if monthly close below June 30's 7,499.36 breaks pattern
Economic backdrop: Fed at 3.50-3.75% with next FOMC July 28-29 (16 days away) pricing 78% hold probability versus 22% hike per Polymarket, June FOMC minutes July 8 revealed hawkish shift with dot plot revised higher to 3.8% end-2026 from 3.4% and 2026 PCE inflation raised to 3.6% from 2.7% creating higher-for-longer narrative despite June NFP weak 57K validates softening labor
Fundamental assessment: Forward PE 20-21x at 10-15% premium to historical 18x median justified by exceptional Q2 2026 earnings growth tracking 23.3% with 89% beat rate through July 10 (18 of 18 companies) and record 13.7% net margins, but elevated expectations create vulnerability to disappointment as earnings season begins Monday July 13 testing guidance quality
Technical Landscape
Uptrend confirmed - ES 7,620 decisively above 50-day MA 7,509 (+1.5%) and 200-day MA 7,472 (+2.0%) with RSI 66.17 healthy bullish momentum, yet breadth weakness 41.3% advancing versus 57.7% declining and failure to sustain above 7,650 resistance creates consolidation pattern awaiting Monday July 13 earnings catalyst for directional resolution
Trend strength registers at 7/10, suggesting meaningful but not extreme directional bias.
Risk-Reward Assessment
Primary risk: Q2 earnings season beginning Monday July 13 delivers results below 23.3% growth expectations or profit margin compression from record 13.7% levels triggering multiple contraction from forward PE 20-21x elevated valuations, while extreme equity put/call 0.55 complacency unwinds violently testing 7,538 immediate support then 7,482 major support as VIX re-expands above 17 (Probability: medium)
Primary opportunity: Q2 earnings season validates 23.3% growth trajectory with major financials and technology delivering strong guidance July 13-18 enabling sustained breakout above 7,650 toward 7,750-7,850 targets as extreme AAII bearish positioning (37.2% bears versus 36.3% bulls) reverses into relief rally and VIX compression below 15 creates chase dynamics (Timeframe: July 13-25 2026)
This week's edge: Market may be underestimating significance of breadth deterioration (41.3% advancing versus 57.7% declining) occurring precisely as rally narrows into Monday July 13 earnings catalyst while overestimating Q2 earnings upside surprise probability given 23.3% growth expectations already upgraded 4.5pp during quarter representing high bar - extreme starting complacency at put/call 0.55 combined with Q2 earnings blackout removing systematic buyback bid creates structural vulnerability consensus dismisses
Risk Environment
With vol at the 42th percentile over 90 days, ES futures is in a measured regime that doesn't require unusual adjustments. Volatility is stable, with realised vol holding steady across timeframes. This equilibrium can persist but eventually resolves into expansion or contraction.
Normal volatility regime suggests 1.0-1.5% daily ES moves expected with current 7,552-7,628 consolidation representing 1.0% range - Monday July 13 earnings season beginning presents asymmetric expansion risk with potential 2-3% intraday swings on major financial/tech earnings surprises either direction while 7,650 resistance creates technical decision point
Looking Forward
All eyes turn to Q2 2026 earnings season begins Monday July 13 with major financials JPMorgan Chase and Citigroup reporting first, testing whether companies can deliver 23.3% earnings growth expectations with record margins against elevated forward PE 20-21x multiples - first major fundamental validation of current valuation premium on Monday 13 July, which carries enough weight to force a decisive directional move.
The week ahead for S&P 500 futures hinges on whether the prevailing consolidating regime can absorb the scheduled catalysts without a regime shift.
This analysis covers one dimension. Our full weekly report combines six specialist agents into a single actionable briefing with directional bias, key levels, and risk-opportunity matrix.
Start Free — Get the Market of the WeekFree weekly report · No credit card · Upgrade anytime



