S&P 500 Forecast This Week — Outlook, Drivers & Key Levels
This week's S&P 500 outlook: key drivers, volatility context, risk-opportunity assessment and the week ahead.

This Week's Starting Point
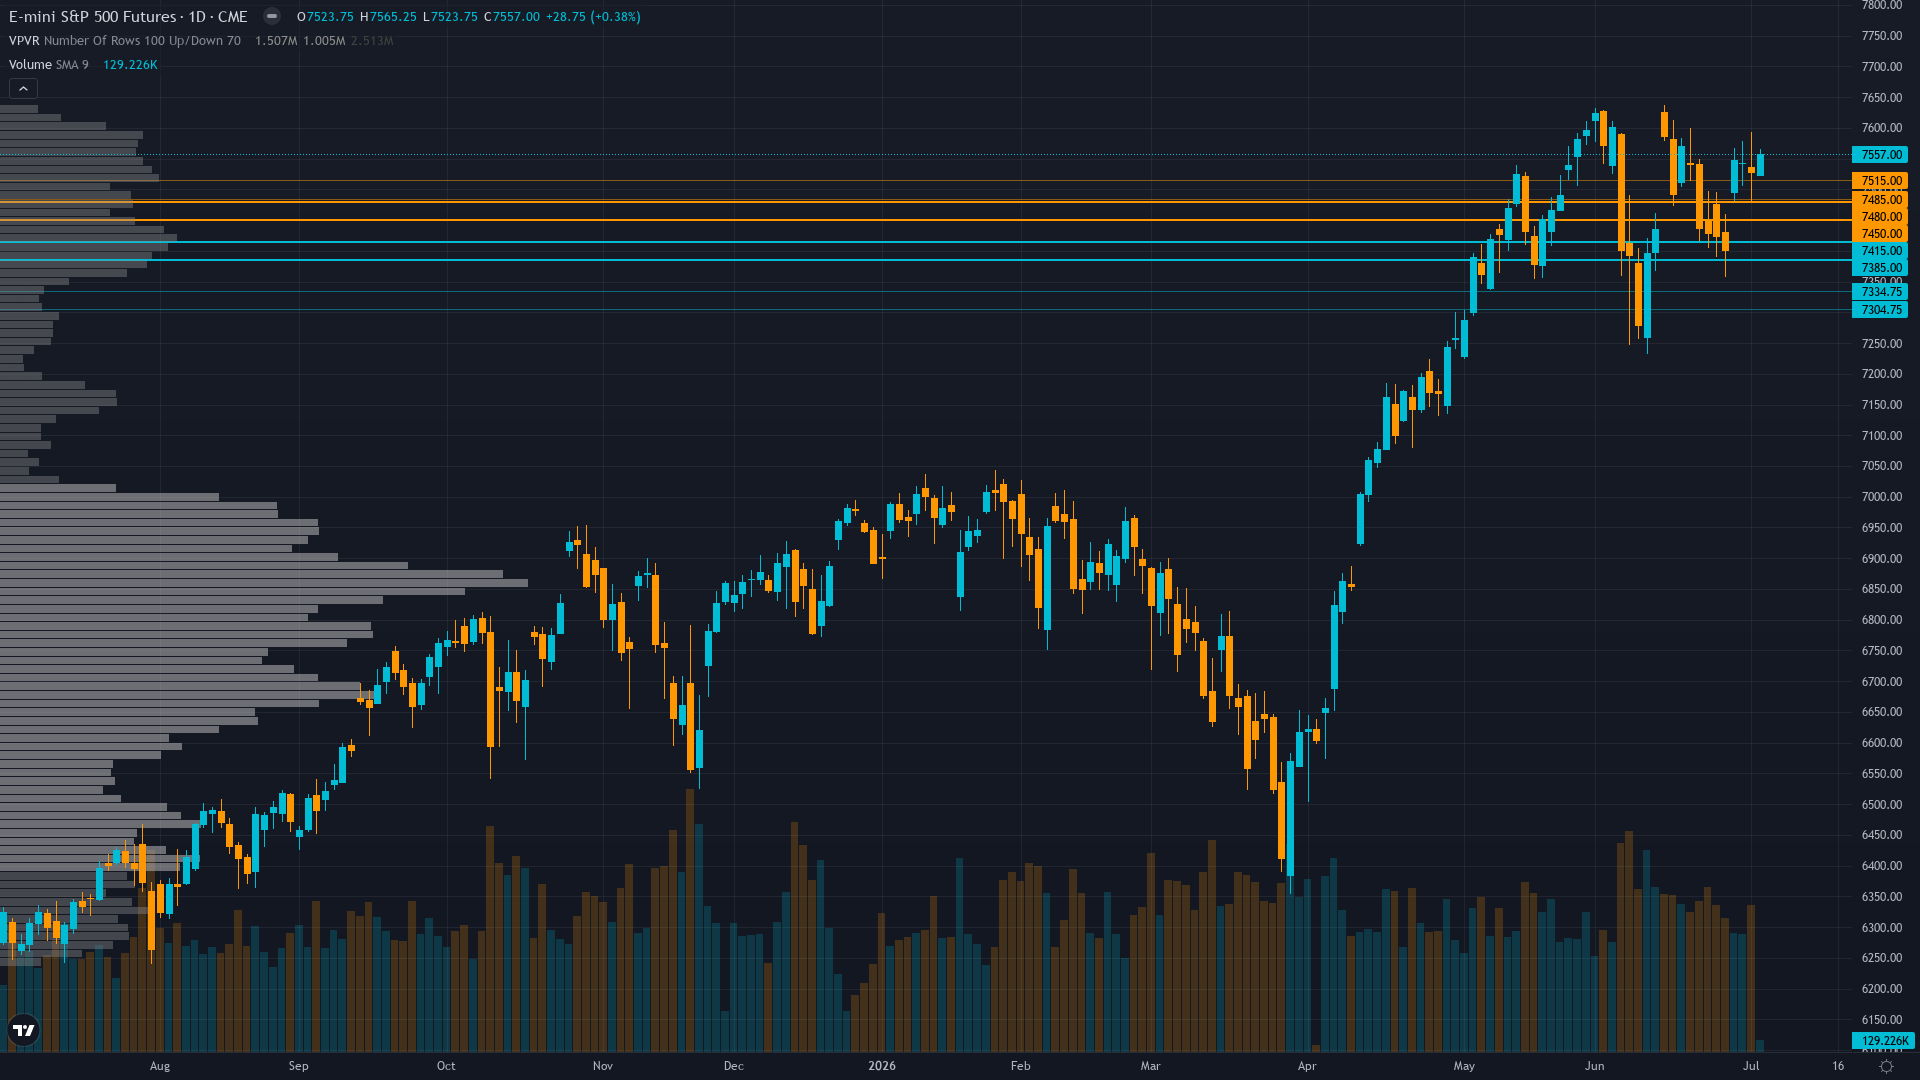
At 7557, S&P 500 has inched 0.27% higher in a measured advance. Price action in S&P 500 futures has compressed into a consolidation pattern, typically a precursor to a directional breakout.
Cautiously bullish on Q2 earnings strength and technical momentum above key moving averages, but increasingly aware extreme put/call 0.53 complacency at 7,557 consolidation creates asymmetric downside risk into July 7-11 earnings catalyst with 7,600 resistance remaining formidable
Forces in Play
Primary driver: Q2 2026 earnings season begins THIS WEEK (July 7-11) with major financials reporting against 23.3% growth expectations upgraded 4.5pp during quarter, creating fresh fundamental catalyst as ES consolidates at 7,557 within 30-day high volume area (7,540-7,557 range) after violent +2.1% recovery from late-June 200-day MA test
Secondary factor: Extreme sentiment capitulation creates contrarian setup - AAII survey shows Bears 42.3% vs Bulls 31.4% (spread -10.9%, well below +6.5% average) after deteriorating 19.7pp in one week from June 24, yet VIX compressed to 16.15 showing calm surface despite crowd fear positioning that historically precedes relief rallies
Additional influence: Options market flashing dangerous complacency warning - equity put/call collapsed to 0.53 from 1.09 two weeks ago (approximately 2 calls per 1 put) while ES ATM IV at 10.2% trades 42% discount to 20-day realized volatility 17.5%, creating structural reversal vulnerability on any negative catalyst from extreme bullish positioning
Economic backdrop: Fed at 3.50-3.75% after June 17 FOMC hold with hawkish dot plot split, but June NFP badly missed at +57K vs 110K consensus (weakest in 4 months) and ISM Manufacturing fell to 53.3 from 54.0 showing data momentum deteriorating despite stable policy - next FOMC July 30-31
Fundamental assessment: Forward PE 20.18x justified by fresh Q2 earnings upward revision to 23.3% growth (+4.5pp during quarter) with Q2 earnings season beginning July 7-11, but CAPE 39.46 at 22% above historical average signals 10-15% overvaluation on cyclically-adjusted basis creating execution risk if companies miss elevated expectations
Technical Landscape
Uptrend intact - ES at 7,557 above 50-day MA 7,413 (+2.0%) and 200-day MA 7,470 (+1.2%) with RSI 59.84 neutral momentum, consolidating within 30-day high volume area 7,540-7,557 after testing 7,600 resistance, awaiting Q2 earnings catalyst for directional resolution
Trend strength registers at 7/10, suggesting meaningful but not extreme directional bias.
Risk-Reward Assessment
Primary risk: Q2 earnings season beginning July 7-11 delivers results below 23.3% growth expectations or profit margins compress from record levels, triggering multiple compression from forward PE 20.18x elevated levels while extreme equity put/call 0.53 complacency unwinds violently testing 7,477 gamma flip then 7,413 50-day MA support (Probability: medium)
Primary opportunity: Q2 earnings season validates 23.3% growth trajectory with major financials and tech delivering strong guidance July 7-18, enabling sustained breakout above 7,600 resistance toward 7,650-7,750 targets as extreme sentiment fear (AAII -10.9% spread) reverses into relief rally and VIX compresses below 16 (Timeframe: July 7-18 2026)
This week's edge: Market may be underestimating significance of extreme sentiment capitulation (AAII -10.9% spread at 1-week deterioration extreme) combined with VIX 16.15 calm creating contrarian reversal setup within 3-7 days, while overestimating Q2 earnings upside surprise probability given 23.3% growth expectations already upgraded 4.5pp during quarter representing high bar - extreme put/call 0.53 complacency contradicts retail fear creating structural vulnerability consensus dismisses
Risk Environment
With vol at the 48th percentile over 90 days, ES futures is in a measured regime that doesn't require unusual adjustments. Volatility is stable, with realised vol holding steady across timeframes. This equilibrium can persist but eventually resolves into expansion or contraction.
Normal volatility regime suggests 1.0-1.5% daily ES moves expected with current 7,540-7,600 consolidation representing 0.8% range - Q2 earnings season beginning July 7-11 presents asymmetric expansion risk with potential 2-3% intraday swings on major financial/tech earnings surprises either direction
Looking Forward
All eyes turn to Q2 2026 earnings season begins with major financials JPMorgan Chase and Citigroup reporting July 11, testing whether companies can deliver 23.3% earnings growth expectations with record margins against elevated forward PE 20.18x multiples - first major fundamental catalyst validating or invalidating current valuation premium on Saturday 11 July, which carries enough weight to force a decisive directional move.
The week ahead for S&P 500 futures hinges on whether the prevailing consolidating regime can absorb the scheduled catalysts without a regime shift.
This analysis covers one dimension. Our full weekly report combines six specialist agents into a single actionable briefing with directional bias, key levels, and risk-opportunity matrix.
Start Free — Get the Market of the WeekFree weekly report · No credit card · Upgrade anytime



