S&P 500 Forecast This Week — Outlook, Drivers & Key Levels
This week's S&P 500 outlook: key drivers, volatility context, risk-opportunity assessment and the week ahead.

This Week's Starting Point
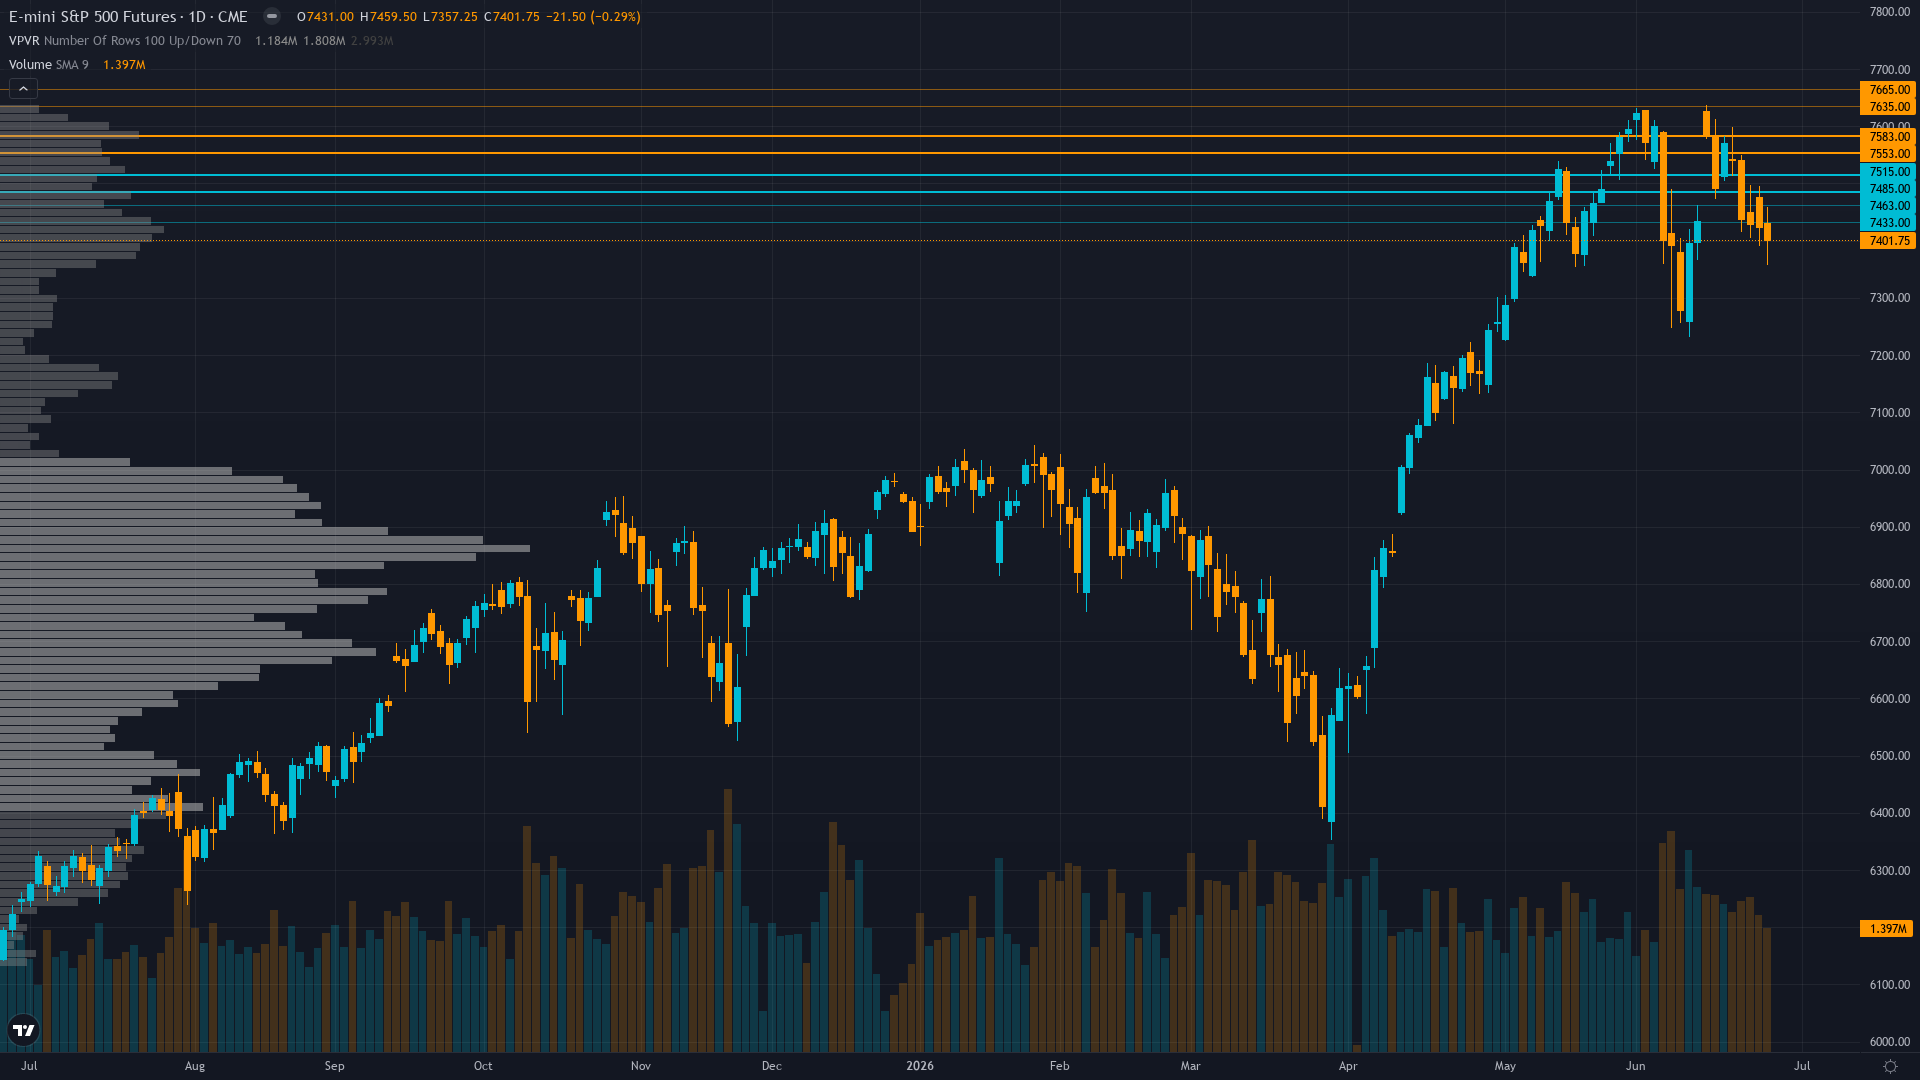
S&P 500 is trading at 7401.75, up a modest 0.12% as the market edges higher. S&P 500 futures is in a breaking down market state, requiring careful assessment of current conditions.
Divided between RSI oversold bounce buyers targeting 7,465-7,500 relief rally and breakdown sellers expecting 7,319-7,200 continuation as June 30 quarter-end binary outcome and Q2 earnings season determine resolution, with majority positioning defensively after worst-day-of-year June 5 precedent
Forces in Play
Primary driver: ES at 7,401.75 tests critical 200-day MA support at 7,430 after -2.05% weekly breakdown from 7,556 consolidation, as Technical discipline's RSI 33.57 oversold signal conflicts with Institutional's quarter-end window dressing bullish calendar mechanics just 2 days before June 30
Secondary factor: Discipline conflict creates binary setup: Technical -2.5 bearish (46% reliable) and Economic -1.5 bearish versus Options +1.5 and Institutional +1.5 bullish, with measured calibration showing Fundamental at 57% most reliable voice supporting +0.5 mild bullish lean on Q2 earnings upward revision fresh catalyst
Additional influence: VIX 18.41 below 20 threshold shows RISK-ON regime persisting despite breakdown, but equity put/call 0.67 only modestly above neutral creates limited hedging cushion while June 5 worst-day-of-year -2.9% selloff precedent warns of fragility near all-time highs
Economic backdrop: Fed at 4.25-4.50% holding with no FOMC until late July creating policy vacuum, May NFP +172K beat validates labor resilience but June 5 selloff precedent (-2.9% worst day of year) suggests market pricing higher-for-longer policy risk
Fundamental assessment: Forward PE 22.06 at fair value justified by fresh Q2 2026 earnings revision upward from 22.2% to 23.1% growth (FactSet week ending June 28 catalyst) with 24% full-year trajectory validating stretched multiples if execution continues, but premium leaves minimal margin for disappointment
Technical Landscape
Critical breakdown - ES 7,401.75 precisely at 200-day MA 7,430.07 inflection after violating 20-day MA 7,465 with RSI 33.57 severely oversold marking deepest reading since March creating mean-reversion potential yet lower-high/lower-low pattern confirms short-term trend reversal from recent highs
Trend strength sits at 4/10, reflecting moderate directional pressure without clear dominance.
Volatility Backdrop
ES futures volatility at the 52th percentile reflects a balanced environment where standard risk parameters apply. Volatility remains anchored at current levels, with no clear signal of an imminent regime shift in either direction.
Normal volatility regime suggests 1.0-1.5% daily ES moves expected with current 7,357-7,459 intraday range representing 1.4% width confirming expansion from prior consolidation - June 30 quarter-end and 200-day MA test create binary decision point with potential 2-3% swings on break either direction
Risk & Opportunity
Primary risk: Breakdown below 200-day MA 7,430 confirms short-term trend reversal from May-June highs triggering systematic deleveraging toward 7,319 then 7,200 major support as post-June 30 quarter-end mechanical buying pressure dissipates and June 5 worst-day precedent validates correction fragility near all-time highs (Probability: medium)
Primary opportunity: RSI 33.57 severe oversold creates 3-5 day capitulation bounce potential toward 7,465 immediate resistance then 7,500 psychological level if 200-day MA 7,430 holds as support and June 30 quarter-end window dressing delivers final mechanical buying before Q2 earnings season validates 23.1% growth trajectory (Timeframe: June 28 - July 3 2026)
This week's edge: Market may be underestimating significance of fresh Q2 earnings upward revision catalyst (22.2% to 23.1% FactSet week ending June 28) occurring precisely at 200-day MA 7,430 inflection while overestimating breakdown continuation probability given RSI 33.57 severe oversold historically precedes relief rallies - calendar mechanics of June 30 quarter-end 2 days away creates near-term support consensus underweights
Looking Forward
On the calendar, Quarter-end June 30 culminates 2-day mechanical window dressing flows with estimated systematic rebalancing pressure creating final bullish push versus consolidation risk, then Q2 earnings season begins early-to-mid July providing next fundamental catalyst for 23.1% growth validation on Tuesday 30 June carries moderate market-moving potential and warrants attention in trade planning.
The week ahead for S&P 500 futures hinges on whether the prevailing breaking down regime can absorb the scheduled catalysts without a regime shift.
This analysis covers one dimension. Our full weekly report combines six specialist agents into a single actionable briefing with directional bias, key levels, and risk-opportunity matrix.
Start Free — Get the Market of the WeekFree weekly report · No credit card · Upgrade anytime



