S&P 500 COT & Institutional Positioning — Smart Money Analysis
S&P 500 institutional positioning: COT data, sentiment analysis and smart money flow assessment.

Institutional Positioning
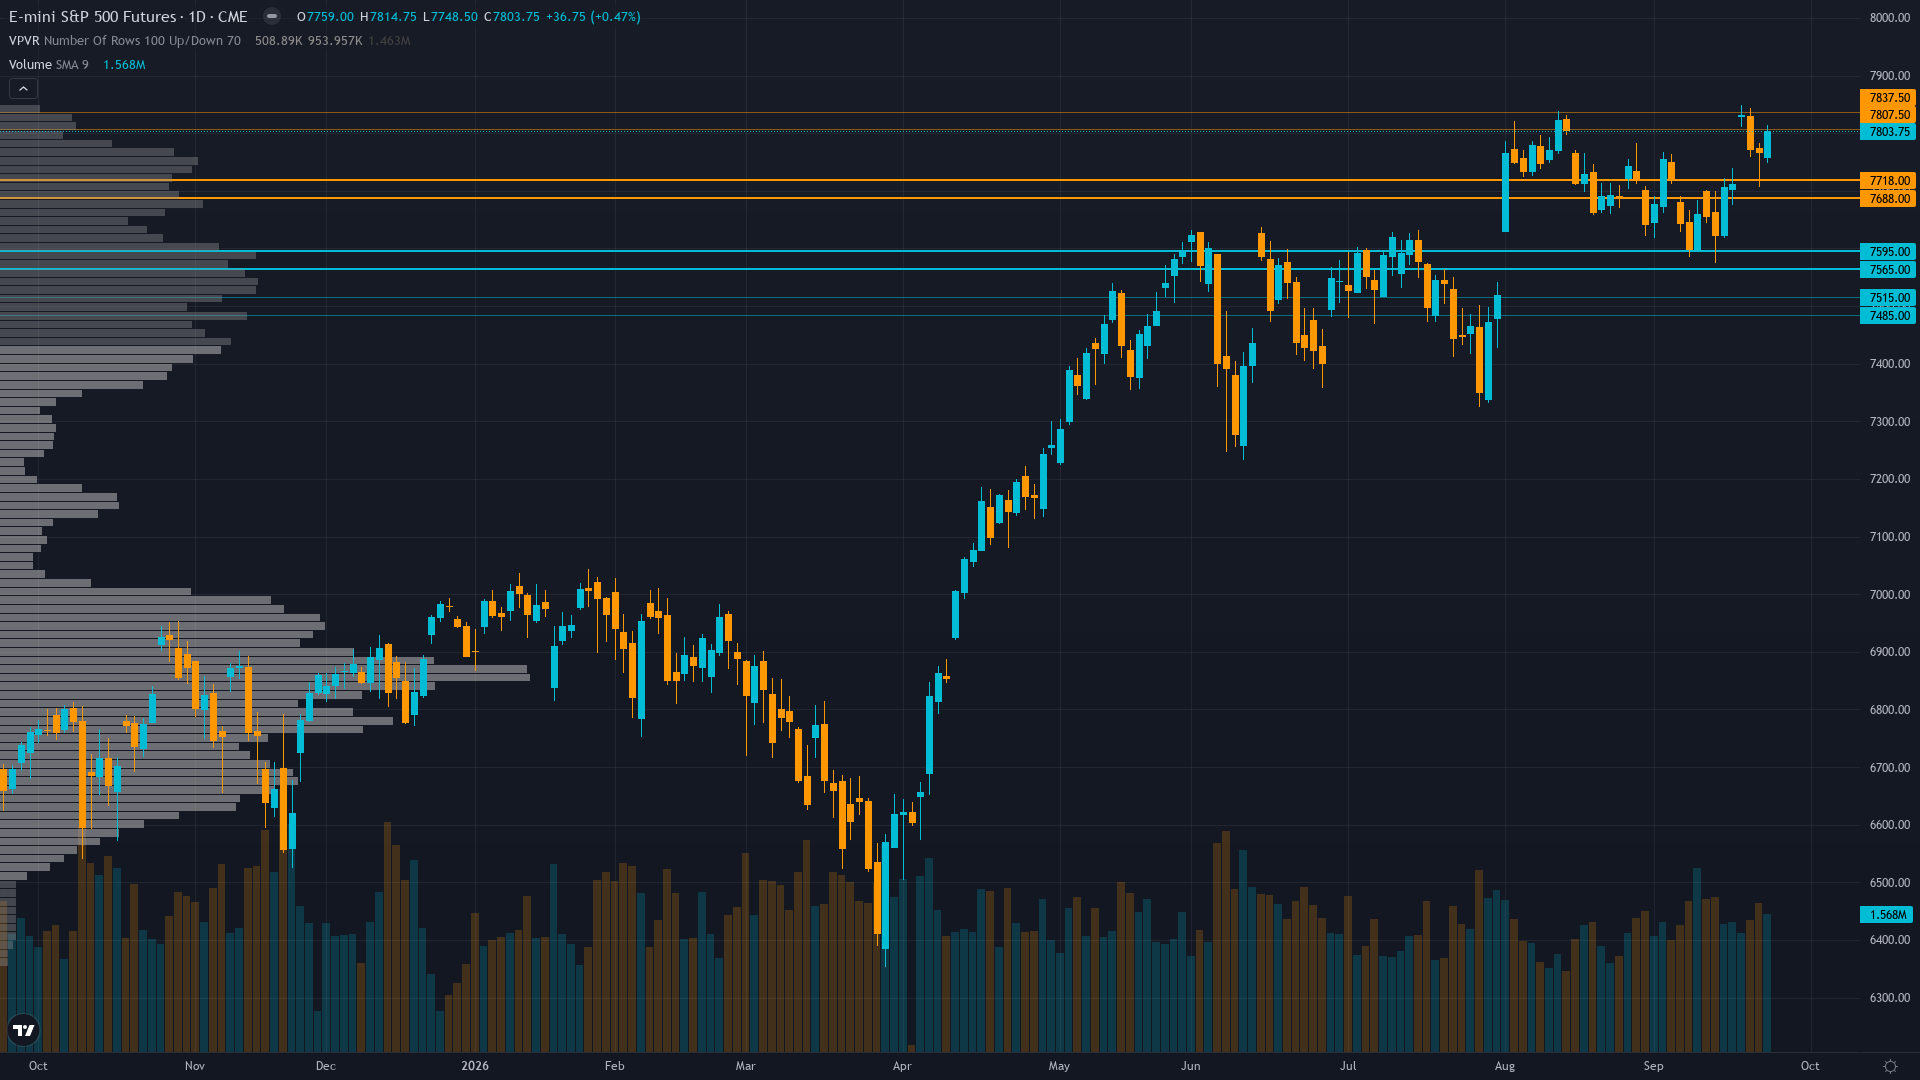
S&P 500 sits at 7803.75 after a 0.47% gain — a quiet move higher without aggressive momentum.
CFTC non-commercial net short -133,228 contracts (32.3rd percentile of 3-year range) after -32,767 contract increase this week — speculative short build accelerating despite ES near ATH, creating asymmetric squeeze potential but positioning is not at extreme percentile; quarter-end window dressing flows Sep 28-30 may provide mechanical buying support from underperforming fund managers adding winners
Where We Agree & Diverge
Market consensus: Cautiously bullish as ES approaches all-time highs at 7,833.5 supported by AI optimism and strong earnings trajectory, with quarter-end flows expected to provide mechanical support, but elevated 10Y yields at 5.17%, oil price pressures, and the Sep 28-29 data/Fed speech cluster creating two-way event risk into month-end
Primary driver: ES rallied +1.91% to 7,803.75 in the week ended Sep 25, trading at 97.9% of the 52-week range (ATH 7,833.5) as technology shares led gains on fresh AI optimism despite a surge in 10-year Treasury yields to 5.17% and oil price pressures, with quarter-end window dressing flows expected Sep 28-30 providing mechanical institutional buying support
Consensus Gaps
Desk issues NO CALL while market has clear bullish directional bias (ES +1.91% near ATHs with strong tech leadership), but the crowd appears to be underweighting the short-squeeze risk from the -32,767 contract one-week speculative short build and the implications of 42-day extended low-vol regime ahead of a dense catalyst window; however, neutral stance limits MAD score to maximum 40 per integrity rules
Sentiment Analysis
Positioning in S&P 500 futures is balanced, with neither bulls nor bears holding a decisive edge. Neutral sentiment typically precedes a directional catalyst.
Derivatives Intelligence
ES implied volatility at 11.64% moderately depressed versus 12% 20-day realized vol (CFTC Sep 25), VIX at 14.87 showing stable expectations with no fear premium for the Sep 28-29 catalyst cluster (JOLTs, Consumer Confidence, multiple Fed speeches), creating asymmetric vol expansion risk on any data surprise or policy guidance shift
Net Assessment
The institutional landscape for ES futures shows fear sentiment. Trend strength registers at 7/10, suggesting meaningful but not extreme directional bias. The combination of positioning data, sentiment, and options flow provides context for understanding where smart money is leaning heading into the week.
This analysis covers one dimension. Our full weekly report combines six specialist agents into a single actionable briefing with directional bias, key levels, and risk-opportunity matrix.
Start Free — Get the Market of the WeekFree weekly report · No credit card · Upgrade anytime


