S&P 500 COT & Institutional Positioning — Smart Money Analysis
S&P 500 institutional positioning: COT data, sentiment analysis and smart money flow assessment.

The Institutional Landscape
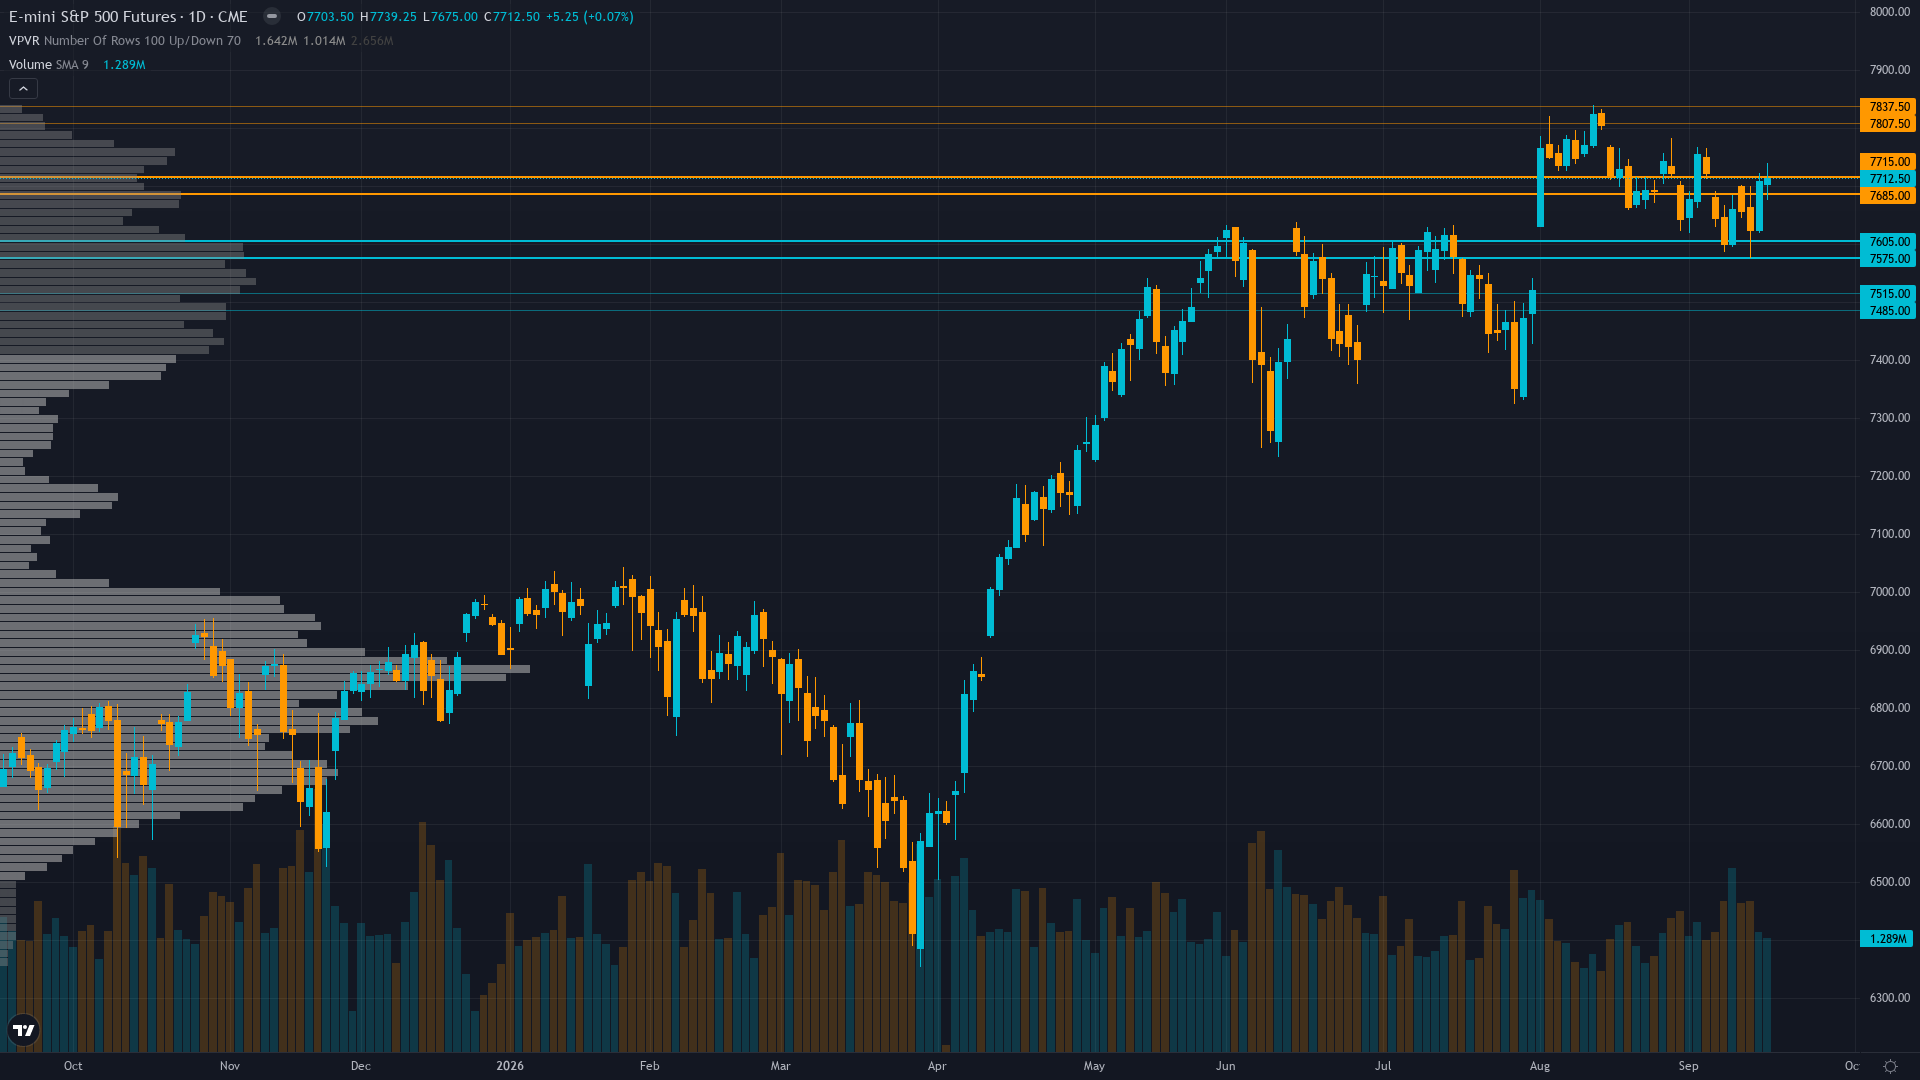
S&P 500 is trading at 7657.35, down 0.07% in a measured pullback.
CFTC non-commercial net short -100,461 contracts at 43rd percentile after reducing shorts by 24,425 contracts week-over-week; quarter-end window dressing approaching Sept 30 may create mechanical buying flows as fund managers add winners for reporting purposes
Market Consensus vs Our Analysis
Market consensus: Cautiously neutral as S&P 500 holds near 7,650 despite 5% 10-year yields and extreme breadth contraction, with market awaiting PMI data and Fed guidance this week for directional catalyst
Primary driver: ES consolidates at 7,657 after a near-flat week (-0.03%) as the S&P 500 cash index closed mixed on Sept 18 triple witching with the 10-year yield reaching 5.01% and extreme breadth contraction (only 119 of 500 stocks advancing), yet the VIX compressed to 14.81 and AAII bearish sentiment surged to 53.3% creating contrarian bullish setup for the week ahead
Contrarian Assessment
Low-to-mild divergence: the desk's NO CALL stance broadly aligns with market caution ahead of Fed speeches and PMI data, but the identification of extreme AAII bearish sentiment at 53.3% (16-month high) creating contrarian opportunity and the extended 35-day VIX compression creating asymmetric vol expansion risk represent nuance the consensus may be underweighting, though limited by neutral bias cap of 40 on MAD score
Sentiment & Positioning
Sentiment around S&P 500 futures is neutral, with no extreme positioning on either side. This balanced state often resolves when a catalyst breaks the equilibrium.
Options Market Signal
VIX at 14.81 on Sept 18 down from 15.44 on Sept 17 as fear premium continued to compress; ES ATM IV at 13.8% vs 8.9% 20-day realized vol creating +4.9 vol risk premium; dealers short gamma at -$5.6B suggesting amplified moves and call wall resistance at 7,700
Putting It Together
In summary, the positioning picture for S&P 500 reflects fear conviction levels set against a consolidating market backdrop. Trend strength registers just 3/10, which typically corresponds to choppy, directionless price action. The interplay between smart money activity, retail sentiment, and options market signals will shape how this positioning resolves.
This analysis covers one dimension. Our full weekly report combines six specialist agents into a single actionable briefing with directional bias, key levels, and risk-opportunity matrix.
Start Free — Get the Market of the WeekFree weekly report · No credit card · Upgrade anytime



