S&P 500 COT & Institutional Positioning — Smart Money Analysis
S&P 500 institutional positioning: COT data, sentiment analysis and smart money flow assessment.

Smart Money Positioning
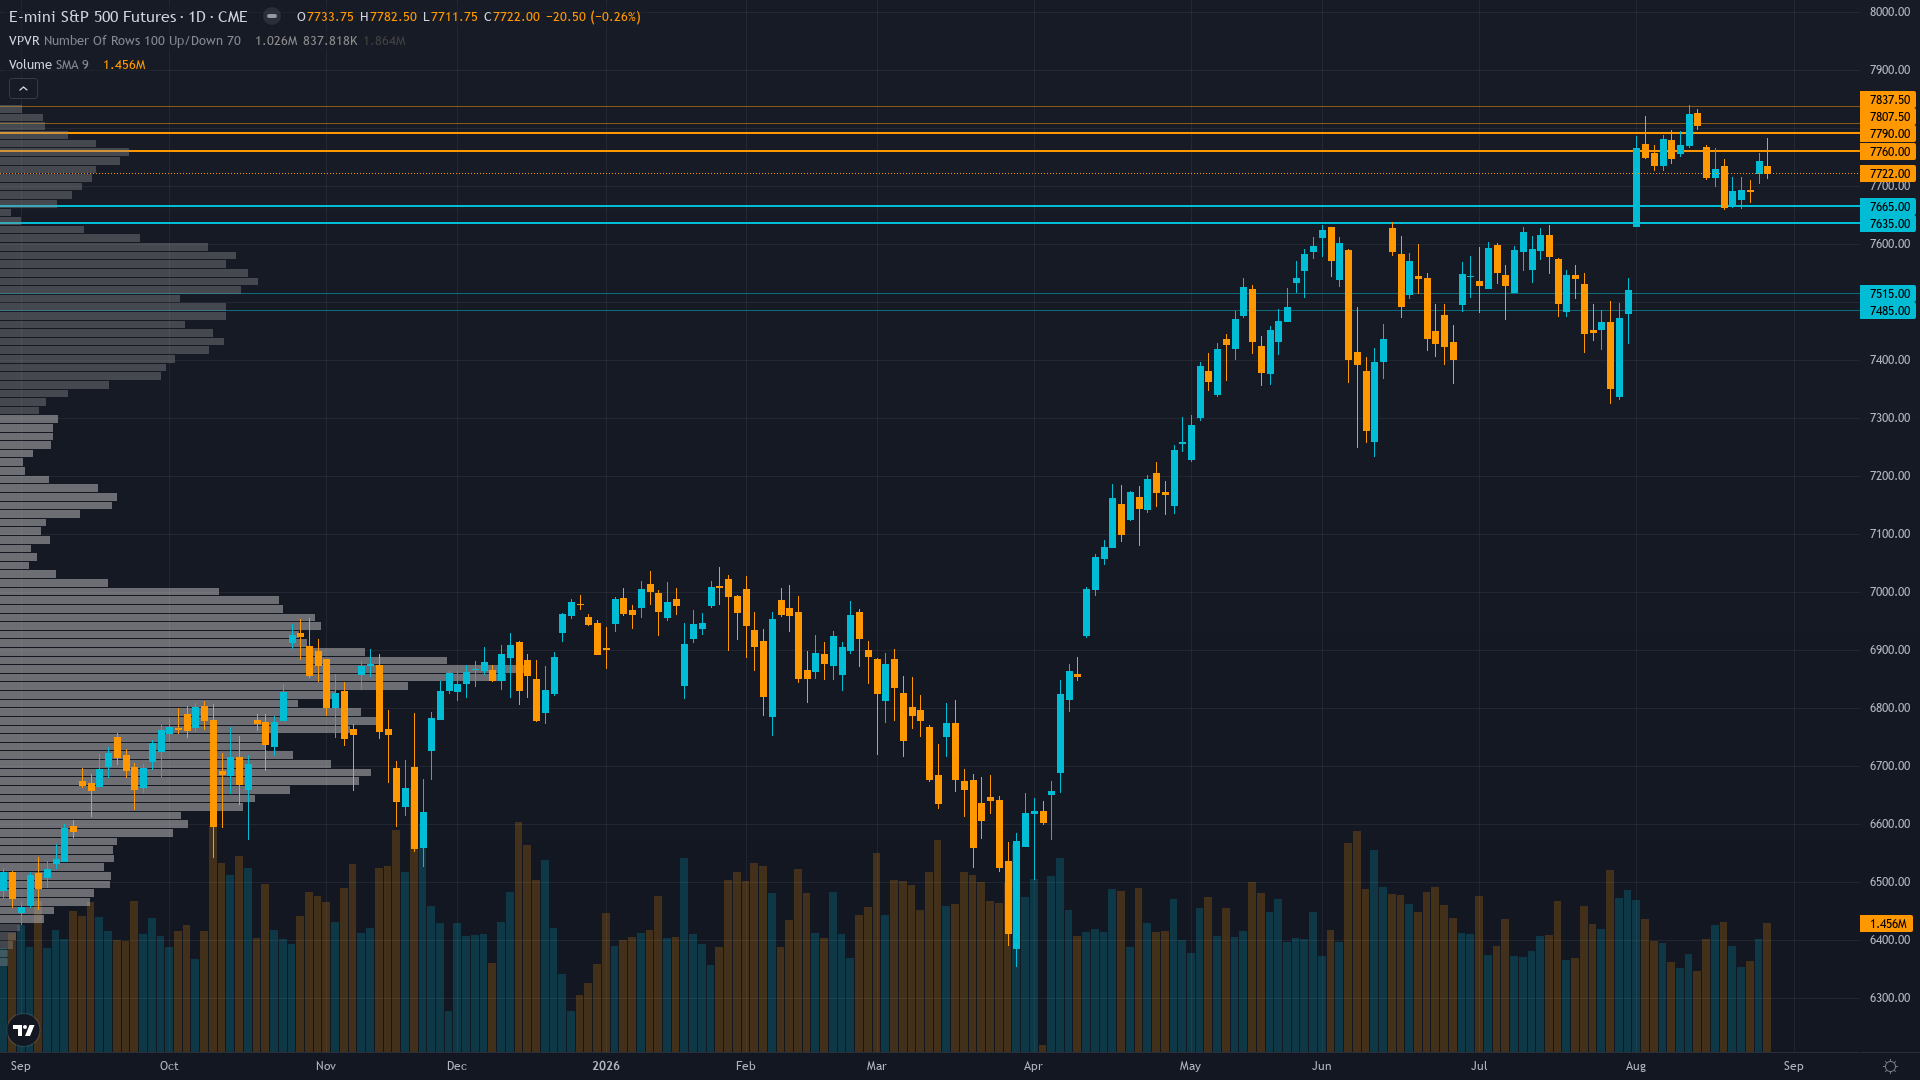
S&P 500 is trading at 7722, down 0.26% in a measured pullback.
CFTC non-commercial net short -67,994 contracts at 58.2nd percentile after -57,434 contract single-week increase — extreme bearish positioning in futures contrasts with SPY $3.9B weekly outflows suggesting profit-taking near highs, creating asymmetric short-covering squeeze setup on any positive catalyst
Consensus Check
Market consensus: Cautiously positioned for continued consolidation near 7,700-7,800 ahead of the dense Sep 1-2 catalyst cluster, with expectations tilted modestly positive on ISM Manufacturing staying expansionary but increasingly aware of September seasonal headwinds after the failed breakout from 7,822.5 ATH
Primary driver: ES consolidates near 7,722 after +0.4% weekly gain that recovered from the prior week's -1.46% pullback from 7,822.5 ATH, with speculative net short positioning surging by -57,434 contracts in one week (CFTC Aug 25) to -67,994 creating powerful short-covering squeeze potential, but the market faces a dense catalyst cluster Sep 1-2 with ISM Manufacturing PMI (est 55.3 vs 55.6), JOLTs, ADP Employment, and Beige Book all arriving in the historically weakest seasonal month for equities
Divergence Assessment
Mild divergence: the desk identifies the extreme -57,434 contract one-week speculative short build as a powerful short-squeeze setup that consensus underweights as it focuses on September seasonal headwinds and the failed ATH breakout, but the NO CALL stance limits divergence scoring as the desk does not oppose consensus directionally
Market Sentiment
The sentiment picture for S&P 500 futures is evenly split, providing no contrarian signal in either direction. The next move will likely be event-driven.
What Options Markets Show
VIX at 14.44-15.13 near 2026 lows reflecting extreme complacency with no fear premium priced for the dense catalyst week ahead — asymmetric vol expansion risk on data surprises Sep 1-2 as compressed vol regime at 10.3% 20-day realised vol leaves the market vulnerable to any disappointment in ISM or employment data
Positioning Summary
Putting the positioning picture together for SPX futures: sentiment is greed, trend strength sits at 6/10, reflecting a market that has directional bias but hasn't reached extreme conviction. The net assessment from institutional data, crowd positioning, and derivatives activity points to a market where the balance of forces tilts in a discernible direction.
This analysis covers one dimension. Our full weekly report combines six specialist agents into a single actionable briefing with directional bias, key levels, and risk-opportunity matrix.
Start Free — Get the Market of the WeekFree weekly report · No credit card · Upgrade anytime



