S&P 500 COT & Institutional Positioning — Smart Money Analysis
S&P 500 institutional positioning: COT data, sentiment analysis and smart money flow assessment.

Smart Money Positioning
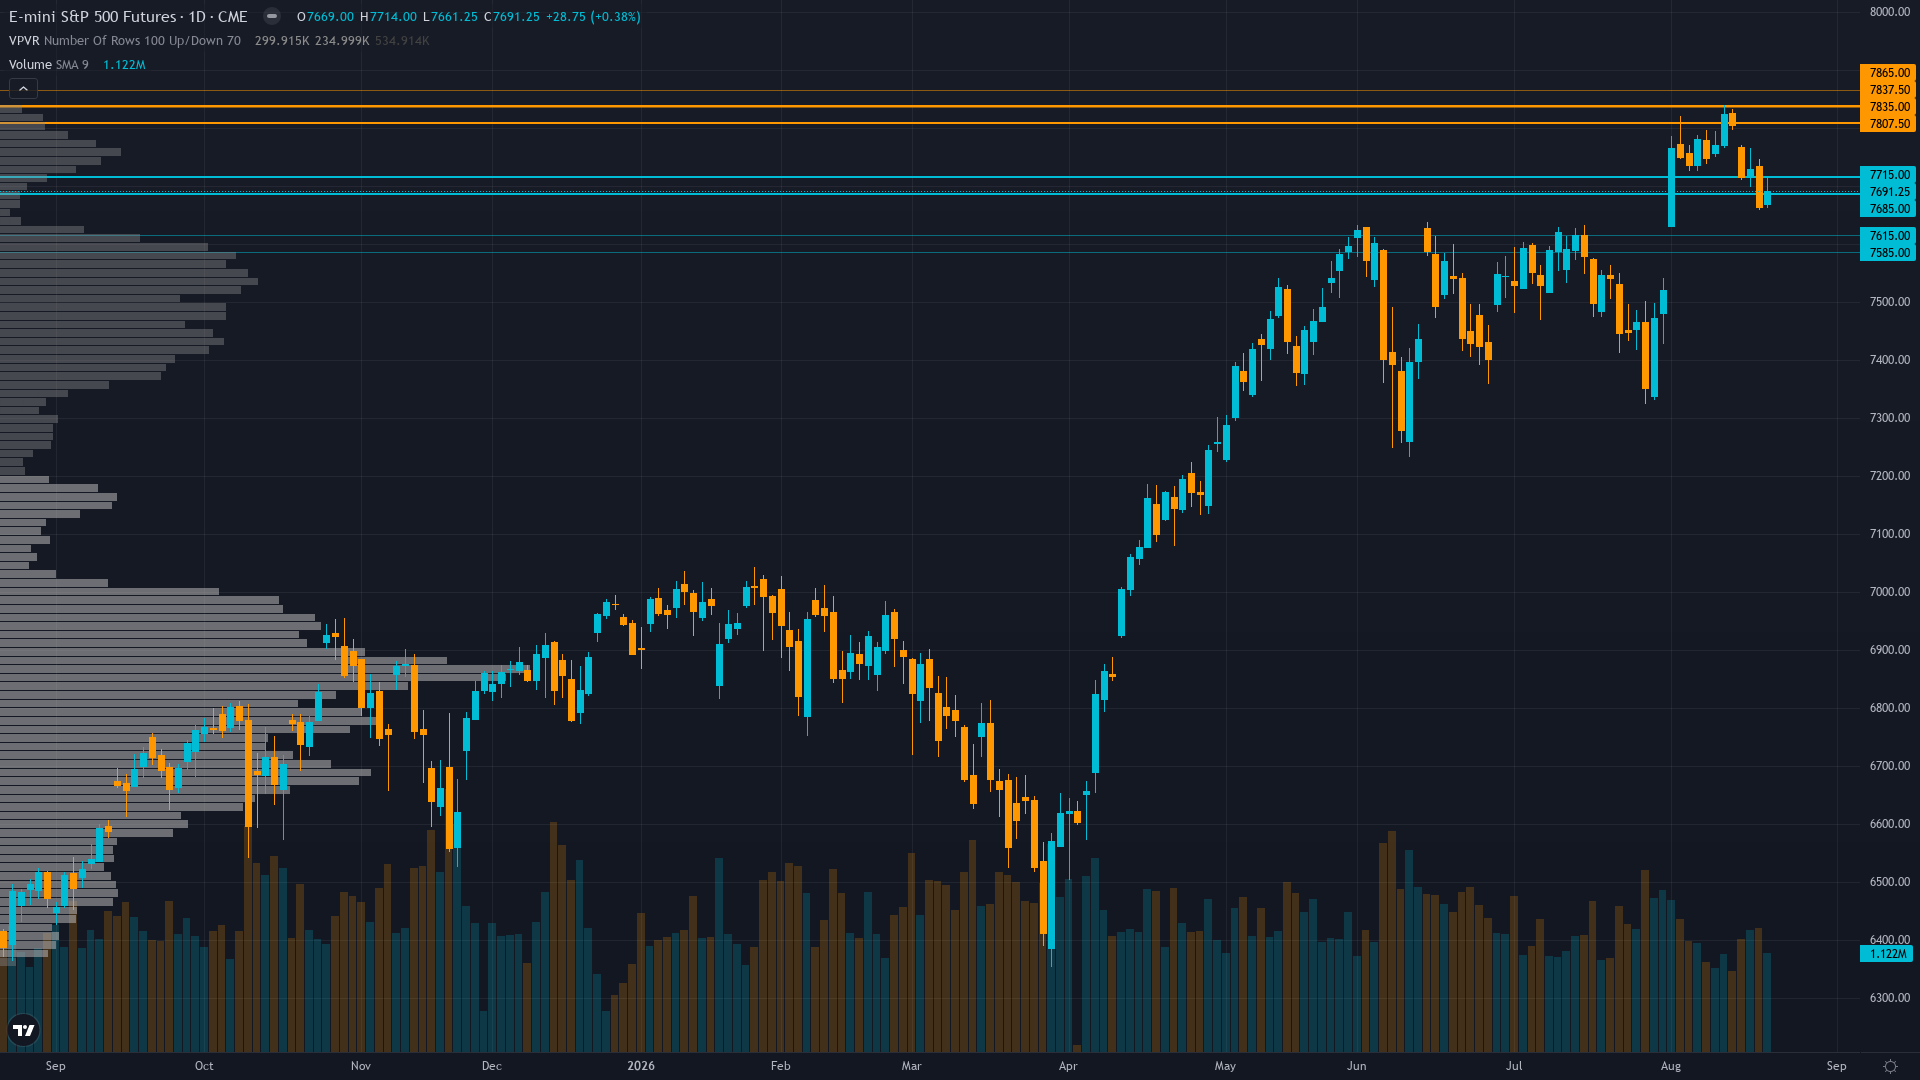
S&P 500 sits at 7691.25 after a 0.38% gain — a quiet move higher without aggressive momentum.
CFTC non-commercial net short -10,560 contracts at 85.4th percentile after flipping from net long +11,280 two weeks ago — extreme bearish positioning creates mean-reversion/short-covering risk rather than continuation signal
Consensus Check
Market consensus: Cautiously expecting a bounce from 7,690 support ahead of Jackson Hole, but reduced conviction after last week's failed breakout from 7,822.5 ATH with Core PCE and Warsh speech creating binary two-week catalyst window
Primary driver: ES pulled back -1.46% from 7,805 to 7,691 last week after failing at 7,822.5 all-time high resistance, with the uptrend structure intact above 7,690 support but momentum decaying ahead of Jackson Hole Aug 27-29 and Core PCE Aug 26 binary catalysts
Divergence Assessment
Desk issues NO CALL (neutral) while market consensus expects a bounce toward ATH from 7,690 support ahead of Jackson Hole, creating mild directional divergence; the extreme speed of COT flip from +11,280 to -10,560 in two weeks is an underappreciated short-squeeze setup that consensus underweights
Market Sentiment
The sentiment picture for S&P 500 futures is evenly split, providing no contrarian signal in either direction. The next move will likely be event-driven.
What Options Markets Show
VIX at 15.87 indicates neutral volatility with mild complacency — not pricing significant event risk for Jackson Hole, creating asymmetric expansion vulnerability if Warsh deviates from data-dependent messaging
Positioning Summary
Putting the positioning picture together for SPX futures: sentiment is greed, trend strength sits at 6/10, reflecting a market that has directional bias but hasn't reached extreme conviction. The net assessment from institutional data, crowd positioning, and derivatives activity points to a market where the balance of forces tilts in a discernible direction.
This analysis covers one dimension. Our full weekly report combines six specialist agents into a single actionable briefing with directional bias, key levels, and risk-opportunity matrix.
Start Free — Get the Market of the WeekFree weekly report · No credit card · Upgrade anytime



