S&P 500 COT & Institutional Positioning — Smart Money Analysis
S&P 500 institutional positioning: COT data, sentiment analysis and smart money flow assessment.

The Institutional Landscape
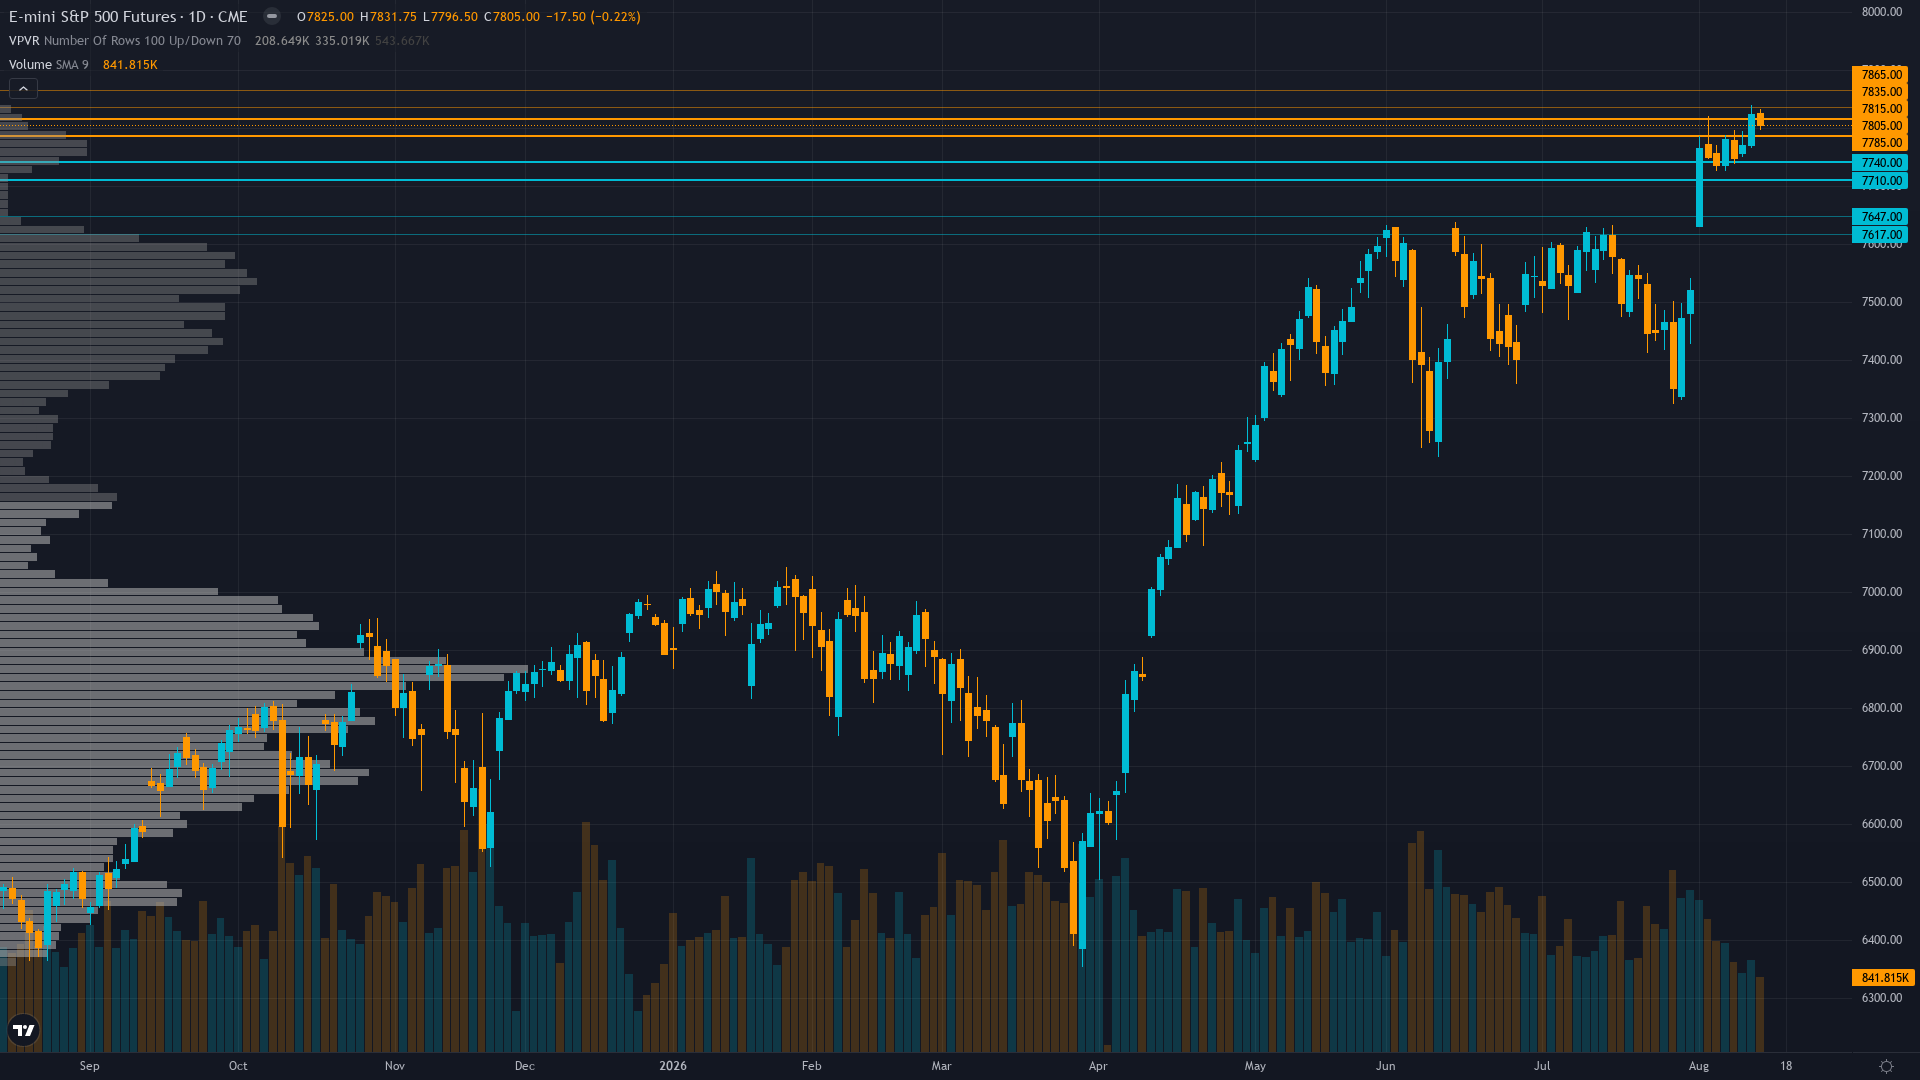
Trading at 7805 with a 0.22% dip, S&P 500 is giving back ground gradually.
CFTC non-commercial net long +11,280 contracts at 90.5th percentile after +38.5K surge in one week — positioning entering extreme territory creating mean-reversion risk; corporate buyback blackout period ongoing removes structural demand support
Market Consensus vs Our Analysis
Market consensus: Broadly bullish after third straight weekly gain driven by AI capex cycle and VIX compression to new lows, with S&P 500 near record highs supported by controlled inflation and earnings strength, though August seasonal weakness and overbought conditions create caution ahead of Housing Starts/Industrial Production data Aug 18 and Jackson Hole Aug 27-29
Primary driver: ES at 7,805 near all-time high 7,822.5 after third straight weekly gain (+0.32% week to Aug 14) in sustained uptrend driven by AI capex cycle ($725B hyperscaler spending in 2026) and VIX compression to 14.25-14.6 new 2026 lows reflecting extreme complacency as market ignores August-September seasonal headwinds heading into critical Jackson Hole catalyst Aug 27-29
Contrarian Assessment
Mild divergence: desk's BULLISH bias aligns with market consensus directionally, but the identification of extreme COT positioning at 90.5th percentile flipping from net short to long in 3 weeks, combined with VIX at 2026 lows pricing complacency ahead of August seasonal headwinds and Jackson Hole policy uncertainty, represents nuance the consensus is underweighting — not a contrarian bet but a measured risk-aware assessment within the prevailing bullish framework
Sentiment & Positioning
Sentiment around S&P 500 futures is neutral, with no extreme positioning on either side. This balanced state often resolves when a catalyst breaks the equilibrium.
Options Market Signal
VIX at 14.25-14.6 new 2026 lows after four consecutive weekly drops — pricing sub-1% daily moves (~0.92% per standard deviation) reflecting extreme complacency; ES ATM IV at 10.7% trades below 20-day realized vol of 13% creating negative vol risk premium and asymmetric vulnerability to any volatility shock
Putting It Together
In summary, the positioning picture for S&P 500 reflects greed conviction levels set against a trending up market backdrop. With trend strength at 8/10, the prevailing move carries significant force behind it. The interplay between smart money activity, retail sentiment, and options market signals will shape how this positioning resolves.
This analysis covers one dimension. Our full weekly report combines six specialist agents into a single actionable briefing with directional bias, key levels, and risk-opportunity matrix.
Start Free — Get the Market of the WeekFree weekly report · No credit card · Upgrade anytime



