S&P 500 COT & Institutional Positioning — Smart Money Analysis
S&P 500 institutional positioning: COT data, sentiment analysis and smart money flow assessment.

Smart Money Positioning
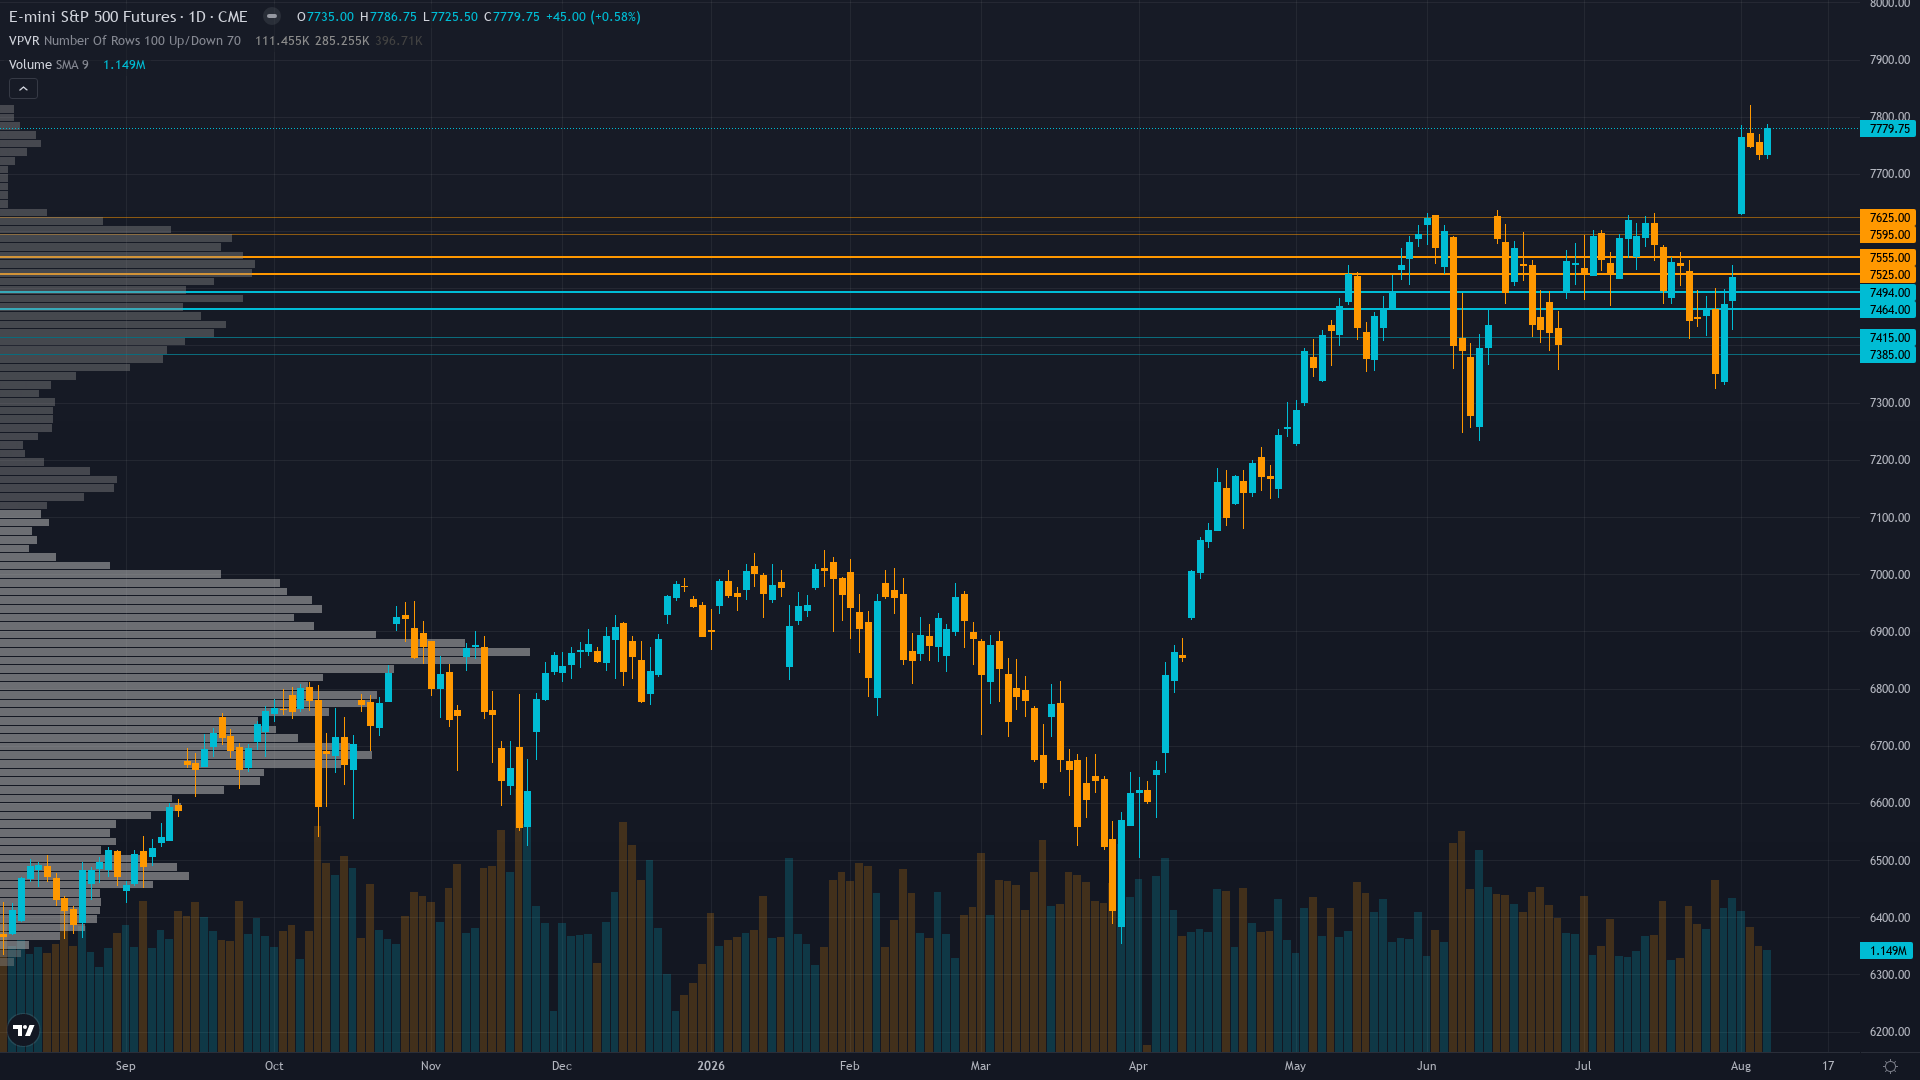
S&P 500 sits at 7779.75 after a 0.58% gain — a quiet move higher without aggressive momentum.
CFTC non-commercial net short -27,258 contracts at 80.4th percentile of 3-year range creating short squeeze potential; IVV $2.71B inflow August 7 signals institutional accumulation at new highs despite speculative shorts persisting
Consensus Check
Market consensus: Broadly bullish after July NFP shock -23K print broke multi-month consolidation, S&P 500 at fresh all-time highs with strong earnings support and rate cut expectations accelerating, though August seasonal weakness and overbought conditions create caution ahead of August 12 CPI catalyst
Primary driver: July NFP shock decline of -23K jobs on August 7 vs +86K expected guts September Fed hike odds, triggering S&P 500 to new all-time high breakout above 7,700 in best weekly performance (+3.46%) since April as rate cut expectations accelerate and AI capex cycle momentum extends
Divergence Assessment
Mild divergence: desk's BULLISH bias aligns with institutional/professional consensus after NFP-driven breakout to ATHs, but the specific short squeeze potential from CFTC net short -27,258 at 80.4th percentile and the implications of the negative NFP print for Fed trajectory may be underappreciated by crowd focused on record high sentiment
Market Sentiment
The sentiment picture for S&P 500 futures is evenly split, providing no contrarian signal in either direction. The next move will likely be event-driven.
What Options Markets Show
ES implied volatility at 10.7% trading below 20-day realized vol of 13.9% reflecting negative vol risk premium; limited put/call data available but VIX 15.15 compression suggests complacency at new highs creating asymmetric reversal vulnerability
Positioning Summary
Putting the positioning picture together for SPX futures: sentiment is greed, with trend strength at 8/10, the prevailing move carries significant force behind it. The net assessment from institutional data, crowd positioning, and derivatives activity points to a market where the balance of forces tilts in a discernible direction.
This analysis covers one dimension. Our full weekly report combines six specialist agents into a single actionable briefing with directional bias, key levels, and risk-opportunity matrix.
Start Free — Get the Market of the WeekFree weekly report · No credit card · Upgrade anytime



