S&P 500 COT & Institutional Positioning — Smart Money Analysis
S&P 500 institutional positioning: COT data, sentiment analysis and smart money flow assessment.

Where Institutions Stand
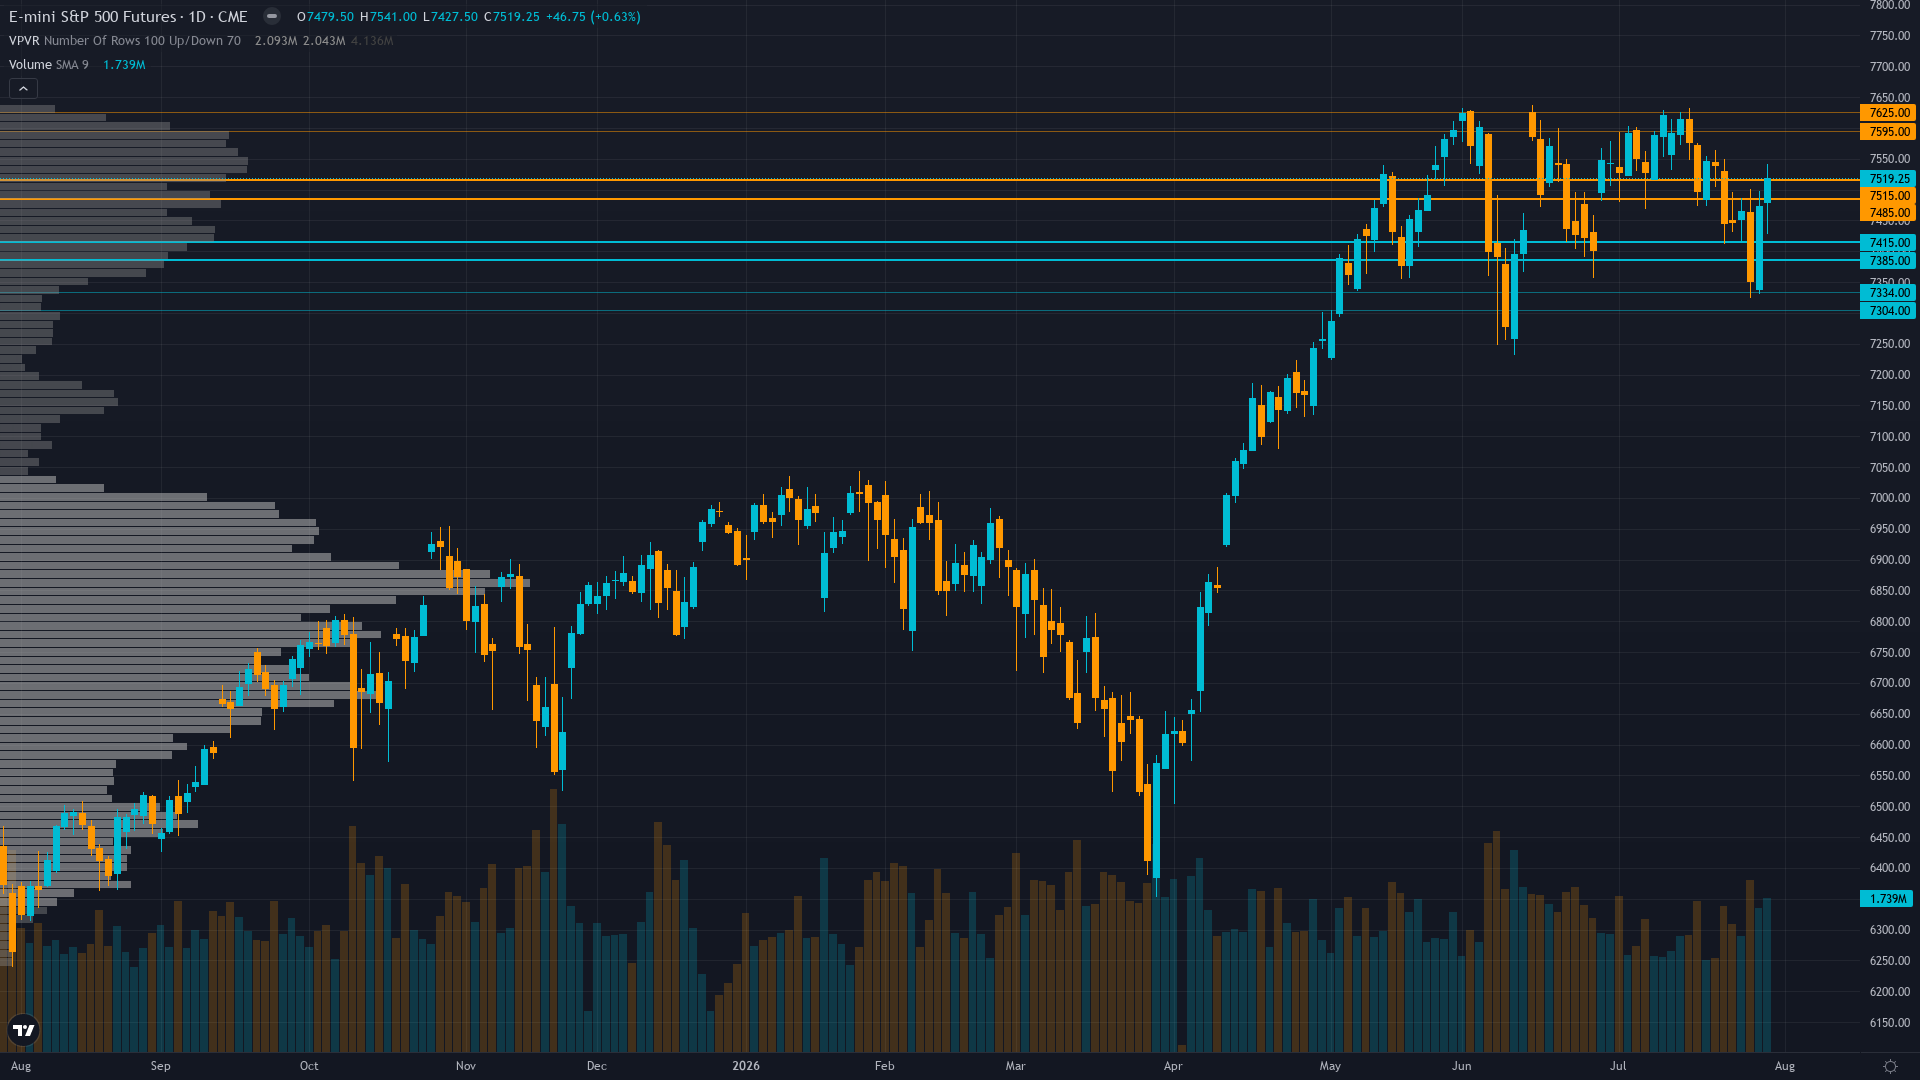
S&P 500 holds at 7519.25, up a marginal 0.53% as the market grinds forward.
August Q3 earnings blackout period removes corporate buyback support and stale COT data limits visibility, but post-FOMC $7.45B net positive gamma regime with dealers long gamma continues dampening intraday volatility and supporting range-bound dynamics
Consensus vs MAD View
Market consensus: Cautiously bullish after FOMC relief rally resolved July technical breakdown, with ES recovering above both 50-day and 200-day MAs but sellers defending 7,540-7,600 resistance ahead of August 7 NFP as the next catalyst for directional resolution
Primary driver: Post-FOMC relief rally digested as ES recovers from 7,447 to 7,519 following July 29 hold decision with three dissents, but 7,540-7,600 resistance cluster caps upside ahead of August 7 NFP catalyst with no fresh earnings or macro catalyst this week
Where the Crowd May Be Wrong
Low divergence: desk issues NO CALL (neutral) while market consensus is mildly bullish post-FOMC relief, creating mild directional divergence of 21-30 range, but conviction is low at 5 and no blindspots identified beyond known NFP binary risk, so total score reflects modest divergence between neutral desk view and cautious bullish market consensus
Crowd Psychology
Neither side has committed heavily to S&P 500 futures, leaving sentiment in a neutral zone that offers little directional guidance on its own.
Options Flow
VIX at 16.00 (-6.44% in 24h) compressed well below 20 threshold after FOMC uncertainty resolved, ES ATM implied volatility at 10.7% depressed relative to historical norms signaling complacency and creating moderate vulnerability to volatility expansion on any negative NFP surprise August 7
The Bottom Line on Positioning
The positioning mosaic for S&P index combines fear sentiment with contracting volatility conditions. Trend strength sits at 5/10, reflecting moderate directional pressure without clear dominance. Taken together, institutional behaviour, crowd psychology, and derivatives data frame the setup heading into the new week.
This analysis covers one dimension. Our full weekly report combines six specialist agents into a single actionable briefing with directional bias, key levels, and risk-opportunity matrix.
Start Free — Get the Market of the WeekFree weekly report · No credit card · Upgrade anytime



