S&P 500 COT & Institutional Positioning — Smart Money Analysis
S&P 500 institutional positioning: COT data, sentiment analysis and smart money flow assessment.

Smart Money Positioning
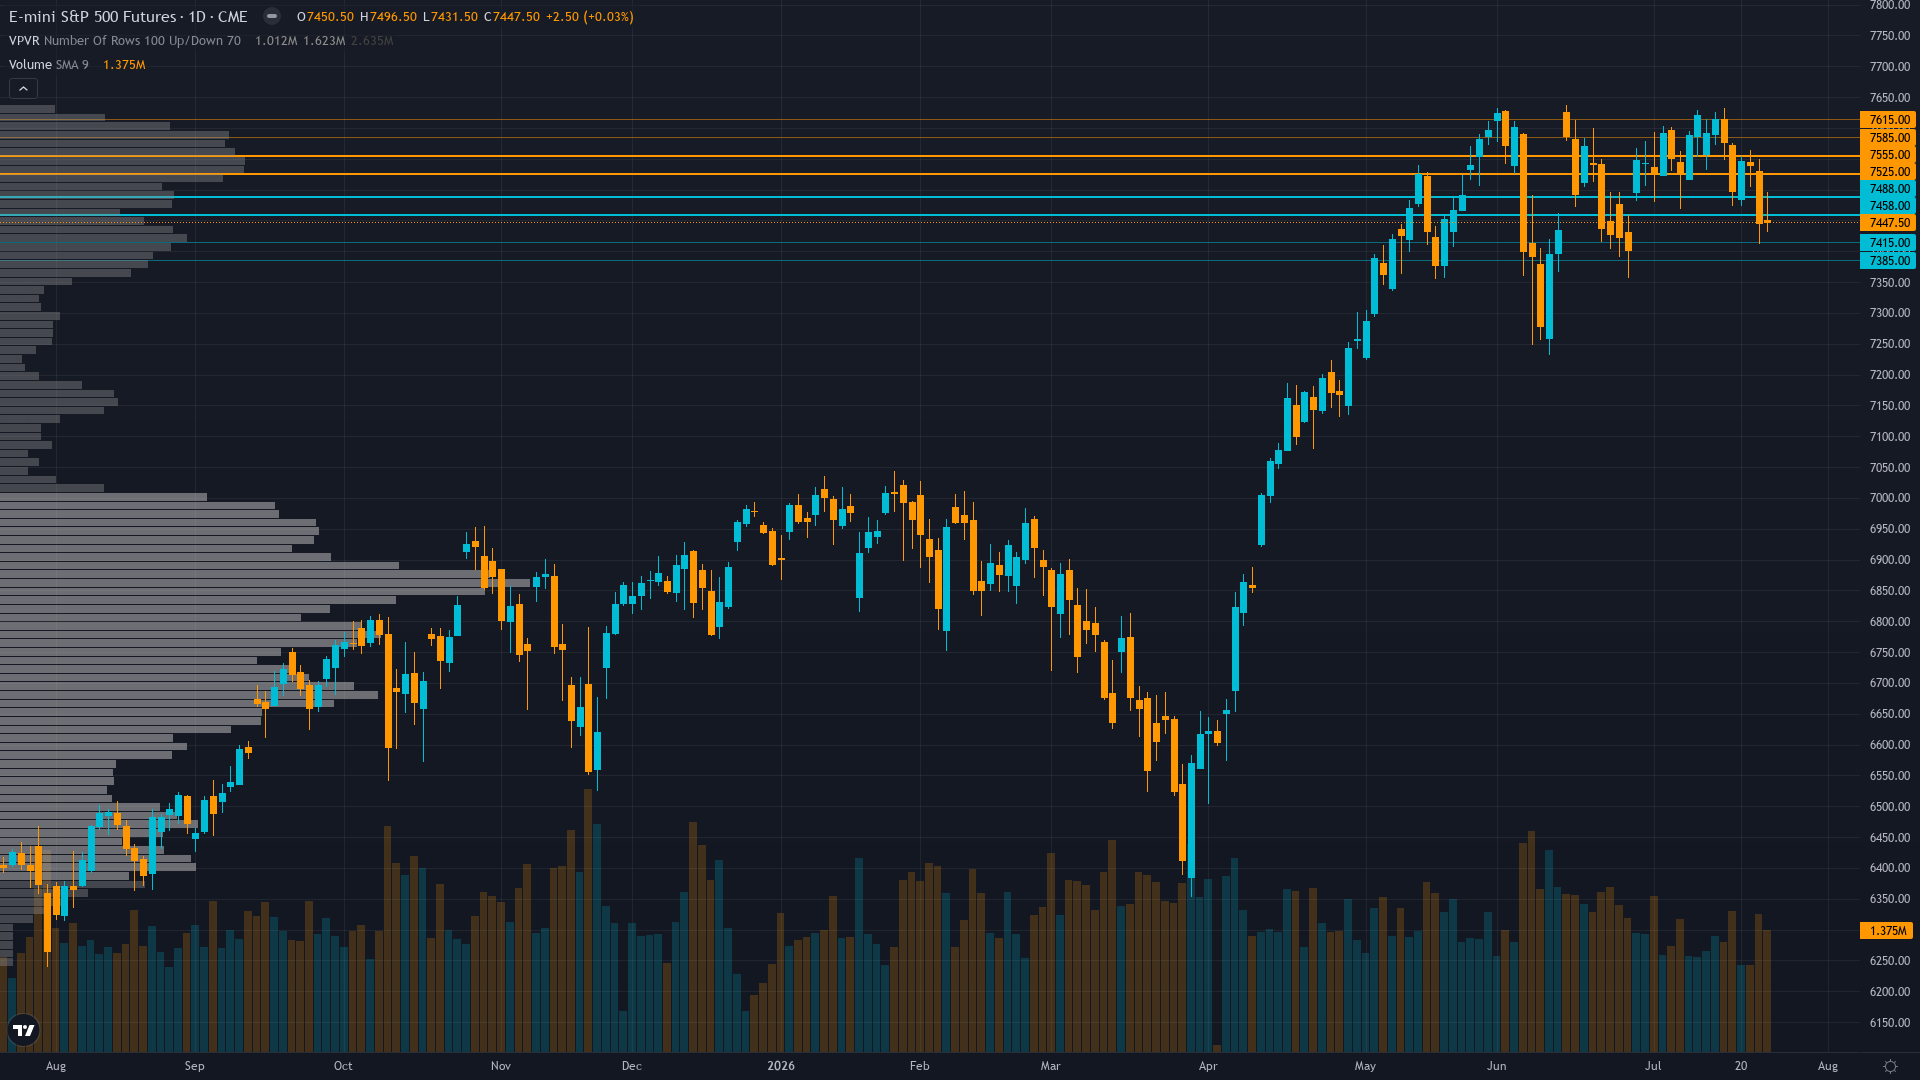
S&P 500 sits at 7447.5 after a 0.03% gain — a quiet move higher without aggressive momentum.
Mid-range positioning per stale July 14 COT data (12 days old) limits visibility but $8.1B SPY outflow July 16 represents institutional profit-taking from June highs creating mechanical headwind, as quarter-end mechanics no longer supportive post-June 30 window
Consensus Check
Market consensus: Divided between oversold bounce buyers targeting 7,500-7,540 relief rally into FOMC and breakdown sellers expecting 7,319-7,200 continuation if Fed delivers hawkish surprise, with majority positioning cautiously ahead of July 29 binary outcome while acknowledging Q2 earnings validation creates fundamental support
Primary driver: ES consolidates at 7,447.50 between 50-day MA 7,506 and 200-day MA 7,479 after -2.36% weekly decline from 7,620 high creating technical damage, as July 28-29 FOMC binary catalyst 3 days away converges with Fed rate hike probability surging to 31% from 13% per Bloomberg while Q2 earnings season 88% beat rate validates 23.3% growth but only creates noise-level price response
Divergence Assessment
Desk NO CALL with sub-threshold signal while market consensus positions for directional resolution into July 29 FOMC creating mild divergence, but Fed hike probability surge to 31% is publicly known via Bloomberg so edge limited to timing assessment rather than blindspot identification
Market Sentiment
The sentiment picture for S&P 500 futures is evenly split, providing no contrarian signal in either direction. The next move will likely be event-driven.
What Options Markets Show
VIX 16.64 compressed below 20 threshold showing calm surface, equity put/call 0.61 (approximately 1.6 calls per put) indicates mild complacency despite technical breakdown creating asymmetric reversal vulnerability on July 28-29 FOMC hawkish surprise
Positioning Summary
Putting the positioning picture together for SPX futures: sentiment is fear, trend strength at 4/10 paints a picture of a market with some direction but lacking strong conviction. The net assessment from institutional data, crowd positioning, and derivatives activity points to a market where the balance of forces tilts in a discernible direction.
This analysis covers one dimension. Our full weekly report combines six specialist agents into a single actionable briefing with directional bias, key levels, and risk-opportunity matrix.
Start Free — Get the Market of the WeekFree weekly report · No credit card · Upgrade anytime



