S&P 500 COT & Institutional Positioning — Smart Money Analysis
S&P 500 institutional positioning: COT data, sentiment analysis and smart money flow assessment.

Where Institutions Stand
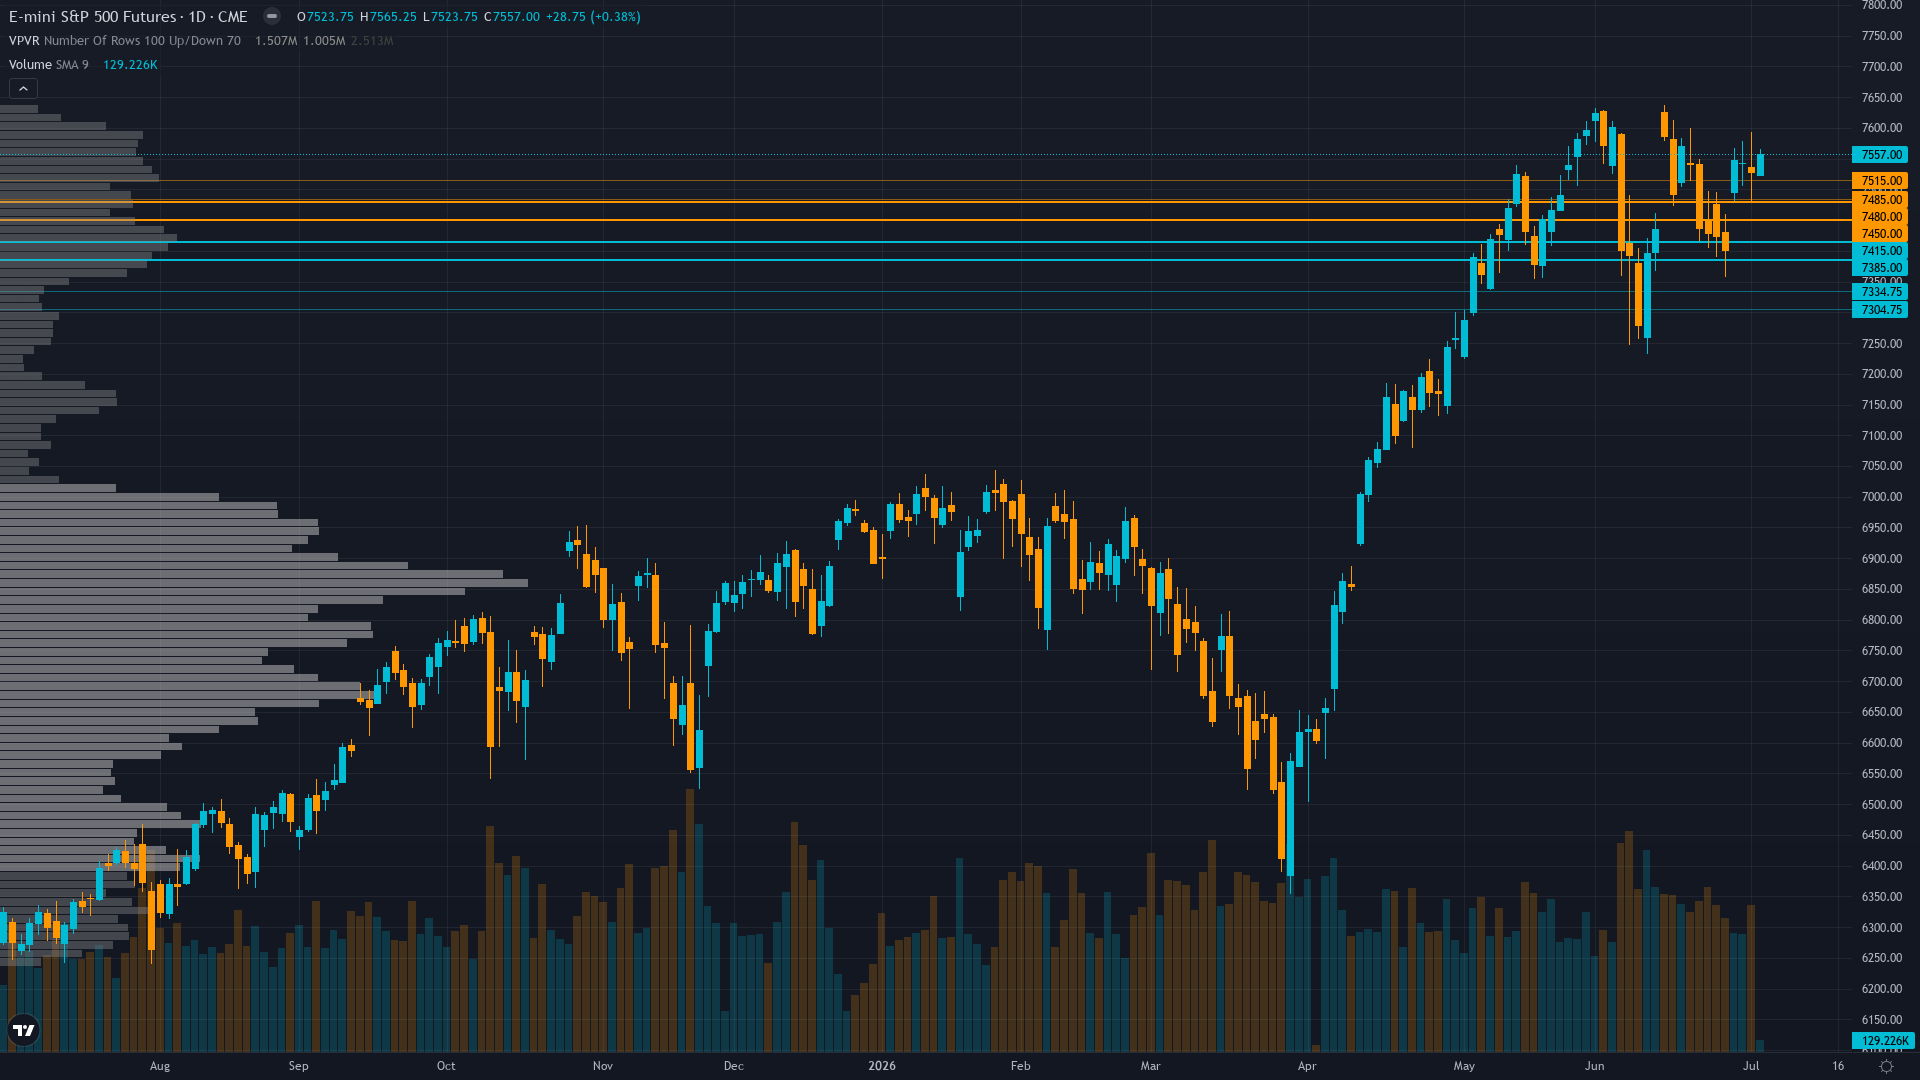
S&P 500 holds at 7557, up a marginal 0.27% as the market grinds forward.
Mid-range positioning per stale June 16 COT data (2.5 weeks old) limits visibility, but quarter-end June 30 rebalancing complete and S&P 500 quarterly rebalance June 22 mechanical flows concluded removing calendar-driven headwinds, creating cleaner technical setup entering Q2 earnings season
Sentiment Analysis
Positioning in S&P 500 futures is balanced, with neither bulls nor bears holding a decisive edge. Neutral sentiment typically precedes a directional catalyst.
Derivatives Intelligence
VIX 16.15 compressed near 52-week low 13.38 showing extreme calm, but equity put/call 0.53 represents dangerous complacency with minimal hedging (2 calls per put) despite proximity to resistance creating asymmetric downside vulnerability - Options discipline -2.5 signal highest conviction bearish warning
Consensus Check
Market consensus: Cautiously bullish on Q2 earnings strength and technical momentum above key moving averages, but increasingly aware extreme put/call 0.53 complacency at 7,557 consolidation creates asymmetric downside risk into July 7-11 earnings catalyst with 7,600 resistance remaining formidable
Primary driver: Q2 2026 earnings season begins THIS WEEK (July 7-11) with major financials reporting against 23.3% growth expectations upgraded 4.5pp during quarter, creating fresh fundamental catalyst as ES consolidates at 7,557 within 30-day high volume area (7,540-7,557 range) after violent +2.1% recovery from late-June 200-day MA test
Positioning Summary
Putting the positioning picture together for SPX futures: sentiment is fear, trend strength sits at 7/10, reflecting a market that has directional bias but hasn't reached extreme conviction. The net assessment from institutional data, crowd positioning, and derivatives activity points to a market where the balance of forces tilts in a discernible direction.
This analysis covers one dimension. Our full weekly report combines six specialist agents into a single actionable briefing with directional bias, key levels, and risk-opportunity matrix.
Start Free — Get the Market of the WeekFree weekly report · No credit card · Upgrade anytime



