Russell 2000 Forecast This Week — Outlook, Drivers & Key Levels
This week's Russell 2000 outlook: key drivers, volatility context, risk-opportunity assessment and the week ahead.

Market Overview
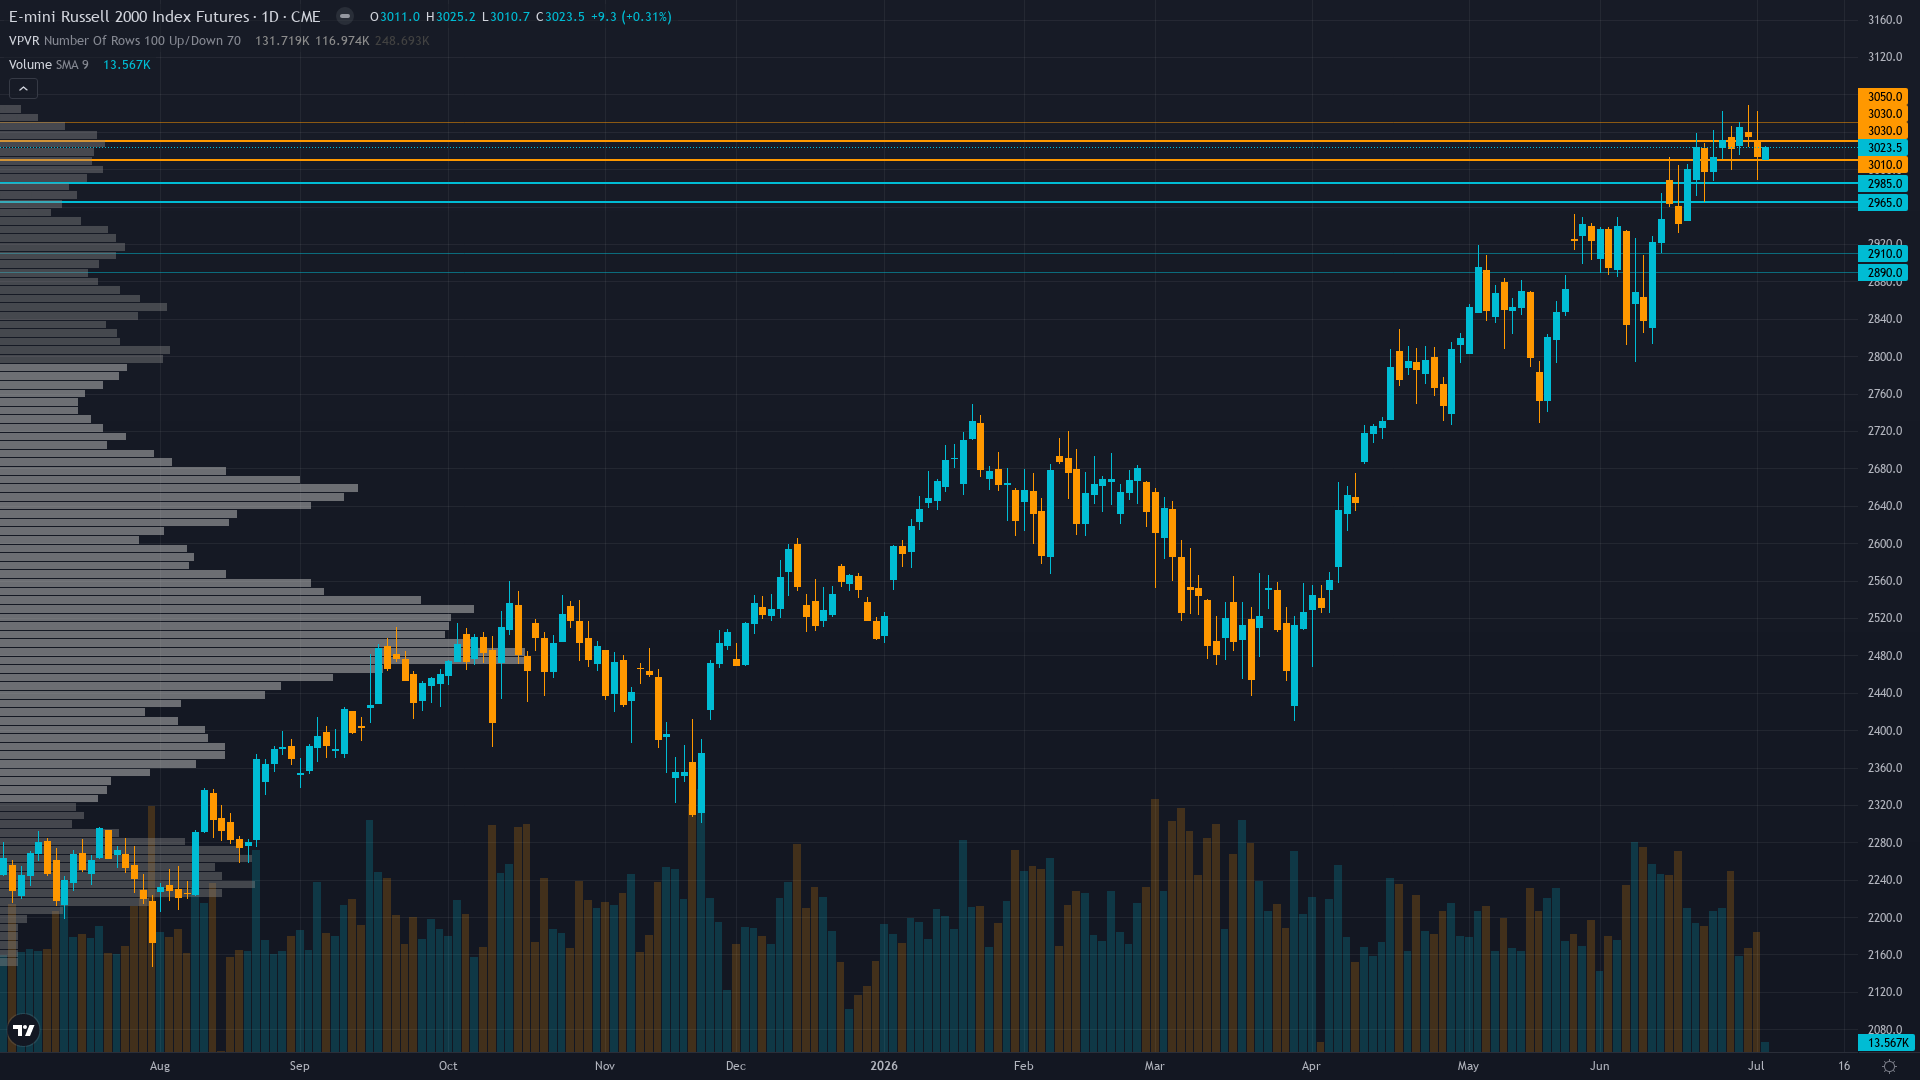
Russell 2000 is trading at 3023.5, up a modest 0.79% as the market edges higher. Russell 2000 futures is range-bound and tightening, with decreasing volatility signalling a directional resolution ahead.
Small-caps consolidating near June 25 all-time high at 3040.1 following successful reconstitution completion June 26, market positioned constructively on Q1 earnings validation and awaiting Q2 earnings season beginning mid-July to test elevated 44.9% growth expectations with Wall Street maintaining small-cap rotation narrative
This Week's Catalysts & Drivers
Primary driver: Four consecutive CORRECT calls (June 12, June 19, June 26, July 3) totaling +5.43% cumulative gain since June 12 validates analytical framework accuracy, but current consolidation at 3023.5 just 0.5% below June 25 all-time high of 3040.1 lacks fresh catalyst after June 26 reconstitution completion exhausted mechanical buying pressure
Secondary factor: Six-discipline unified bullish consensus creates directional agreement (Sentiment 2.5 conf 7, Options 1.5 conf 6, Technical 1.5 conf 6, Fundamental 0.5 conf 4, Institutional 0.5 conf 4, Economic -0.5 conf 6) with only Economic showing mildly bearish lean on June 17 Fed hawkish pivot that removed dovish forward guidance, though 18 days elapsed without fresh policy developments limits catalyst impact
Additional influence: Seasonality entering July-August period historically underperforms for small-caps per RTY asset-specific context, with research indicating mid-July seasonal weakness typically emerges after July 1-15 strength, creating tactical headwind for extended rallies beyond Q3 earnings season beginning mid-July
Economic backdrop: RISK-ON macro regime with VIX 15.81 well below 20 threshold and credit spreads stable, Fed on hold at 3.50-3.75% following June 17 FOMC hawkish pivot that shifted dot plot to show 9 of 18 officials expecting 2026 rate hike, removing small-cap easing narrative though no fresh policy developments since 18-day-old meeting limits immediate impact
Fundamental assessment: Q1 2026 earnings delivered 44.9% YoY growth validating inflection narrative per May 7 LSEG data, but elevated forward P/E at 25.39x versus 13.62-17.34x historical range creates vulnerability to Q2 delivery risk beginning mid-July with no fresh fundamental catalyst this week beyond completed June 26 reconstitution
Technical Picture
Consolidating 0.5% below June 25 all-time high at 3040.1 with current price 3023.5 holding constructive structure above 2995 immediate support, RSI indicators showing neutral momentum without overbought/oversold extremes creating range-bound environment awaiting catalyst
At 7/10, trend strength indicates a solid directional lean without being overextended.
Bull & Bear Case
Primary risk: Sentiment complacency extremes (VIX 15.81 near 52-week lows, put/call 0.53 at multi-year lows, Fear & Greed 32 fear territory but retail AAII bearish at 42.3%) combining with June 26 reconstitution flow exhaustion and seasonal July-August underperformance pattern creating 3-5% correction risk toward 2860-2900 support if Q2 earnings beginning mid-July disappoint elevated 44.9% growth bar or July 28-29 FOMC delivers further hawkish surprise (Probability: medium)
Primary opportunity: Consolidation near June 25 ATH at 3040.1 holding 2995-3023 support creates continuation structure targeting breakout above 3040 resistance toward 3100-3150 measured extension if Q2 earnings beginning mid-July validate 44.9% trajectory and sentiment contrarian setup at AAII 42.3% bearish provides tactical bullish fuel as retail investors positioned defensively while price holds near record highs (Timeframe: 2-4 weeks through Q2 earnings releases beginning mid-July and July 28-29 FOMC meeting clarity)
This week's edge: Market consensus celebrating June 25 ATH and successful reconstitution may be underpricing three converging headwinds: (1) June 26 reconstitution flow exhaustion removing $11 trillion mechanical bid that supported rally, (2) June 17 Fed hawkish pivot (9 of 18 officials expecting 2026 hike versus 1 cut) not yet fully priced for credit-sensitive small-caps despite 18 days elapsed, (3) seasonal July-August underperformance pattern historically pressuring small-caps into Q3—desk recognizes tactical tension between bullish discipline consensus and structural catalyst vacuum requiring reduced conviction at 5 until Q2 earnings or Fed clarity provides fresh directional catalyst
Volatility Regime
Volatility for RTY futures is at the 45th percentile over 90 days — a normal regime that allows for standard position sizing and conventional trade management. The vol trend is flat, with no meaningful shift across timeframes. Stable vol environments often lull traders before a regime change arrives.
Normal volatility regime at 45th percentile supports standard risk management with 2-3% stops below 2860 support, expect 30-50 point daily ranges versus 60-100 during elevated volatility periods, stable pattern suggests consolidation environment until Q2 earnings beginning mid-July or July 28-29 FOMC catalyst provides directional clarity with recent narrow 10-point intraday ranges confirming compression
What History Shows
small-cap futures enters July 2026 without a meaningful seasonal lean (50% win rate). Mid-year earnings season volatility.
The Week Ahead
Federal Reserve FOMC Meeting July 28-29 with statement July 29 and forward guidance critical for rate-sensitive small-caps following June 17 hawkish pivot, though 23 days away reduces near-term directional urgency as Q2 earnings season begins mid-July providing interim catalyst opportunity on Tuesday 28 July is a high-impact catalyst with the potential to redefine the near-term outlook entirely.
How Russell 2000 futures navigates the confluence of consolidating conditions and incoming data will determine whether the current directional thesis holds or breaks.
This analysis covers one dimension. Our full weekly report combines six specialist agents into a single actionable briefing with directional bias, key levels, and risk-opportunity matrix.
Start Free — Get the Market of the WeekFree weekly report · No credit card · Upgrade anytime



