S&P 500 COT & Institutional Positioning — Smart Money Analysis
S&P 500 institutional positioning: COT data, sentiment analysis and smart money flow assessment.

Institutional Positioning
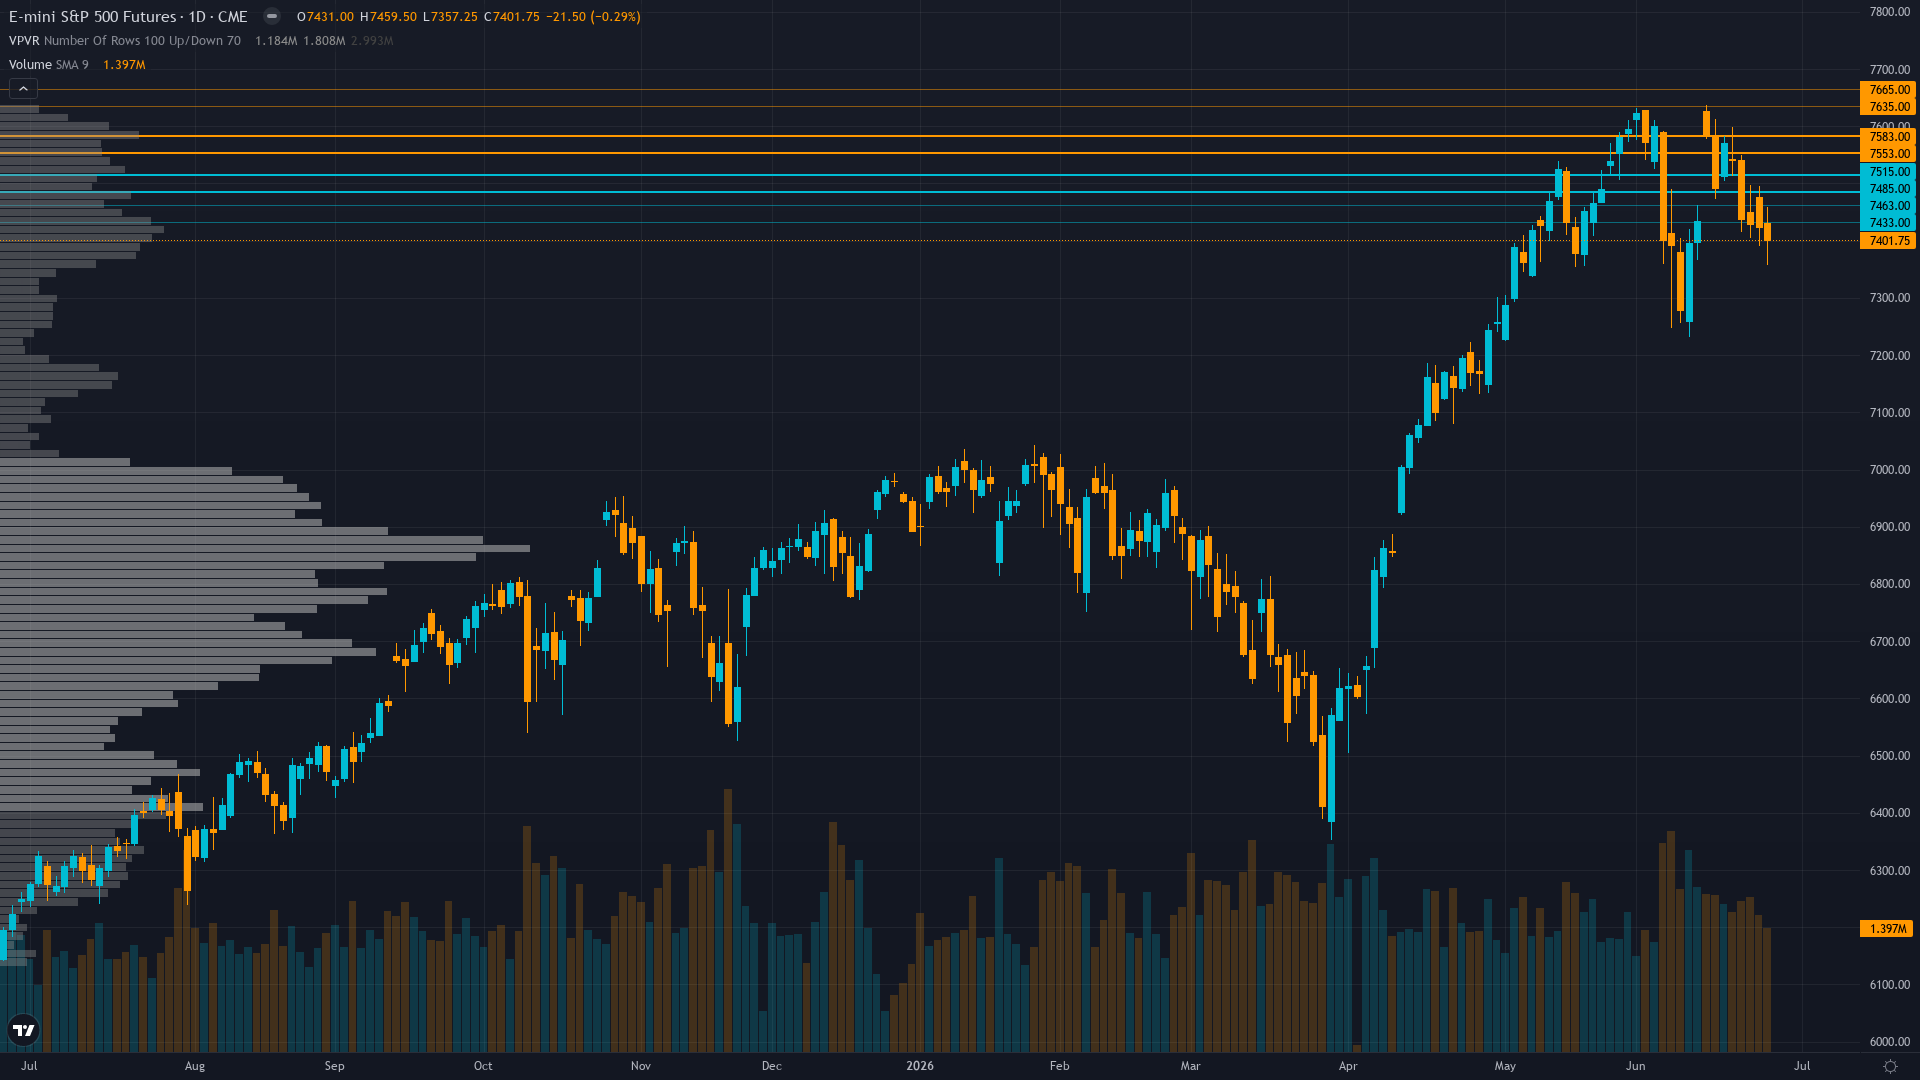
S&P 500 is trading at 7401.75, up a modest 0.12% as the market edges higher.
Conflicted calendar dynamics - quarter-end June 30 window dressing creates 2-day bullish mechanical buying pressure per Institutional +1.5 signal, but strong ETF inflows $66.23B contradict recent breakdown suggesting profit-taking from May-June rally preceding rebalancing
Crowd Psychology
Neither side has committed heavily to S&P 500 futures, leaving sentiment in a neutral zone that offers little directional guidance on its own.
Options Flow
VIX 18.41 compressed from 19.70 open showing fear premium unwinding despite breakdown, equity put/call 0.67 shows modest bullish lean (1.5 calls per put) creating limited defensive cushion compared to historical extremes - IV 12.46% depressed suggests complacency vulnerability
Market Consensus vs Our Analysis
Market consensus: Divided between RSI oversold bounce buyers targeting 7,465-7,500 relief rally and breakdown sellers expecting 7,319-7,200 continuation as June 30 quarter-end binary outcome and Q2 earnings season determine resolution, with majority positioning defensively after worst-day-of-year June 5 precedent
Primary driver: ES at 7,401.75 tests critical 200-day MA support at 7,430 after -2.05% weekly breakdown from 7,556 consolidation, as Technical discipline's RSI 33.57 oversold signal conflicts with Institutional's quarter-end window dressing bullish calendar mechanics just 2 days before June 30
Putting It Together
In summary, the positioning picture for S&P 500 reflects fear conviction levels set against a breaking down market backdrop. Trend strength at 4/10 paints a picture of a market with some direction but lacking strong conviction. The interplay between smart money activity, retail sentiment, and options market signals will shape how this positioning resolves.
This analysis covers one dimension. Our full weekly report combines six specialist agents into a single actionable briefing with directional bias, key levels, and risk-opportunity matrix.
Start Free — Get the Market of the WeekFree weekly report · No credit card · Upgrade anytime



