Soybeans Key Levels This Week — Support, Resistance & Confluence Zones
Soybeans key levels breakdown: support zones, resistance zones, confluence and price structure.

Price Architecture
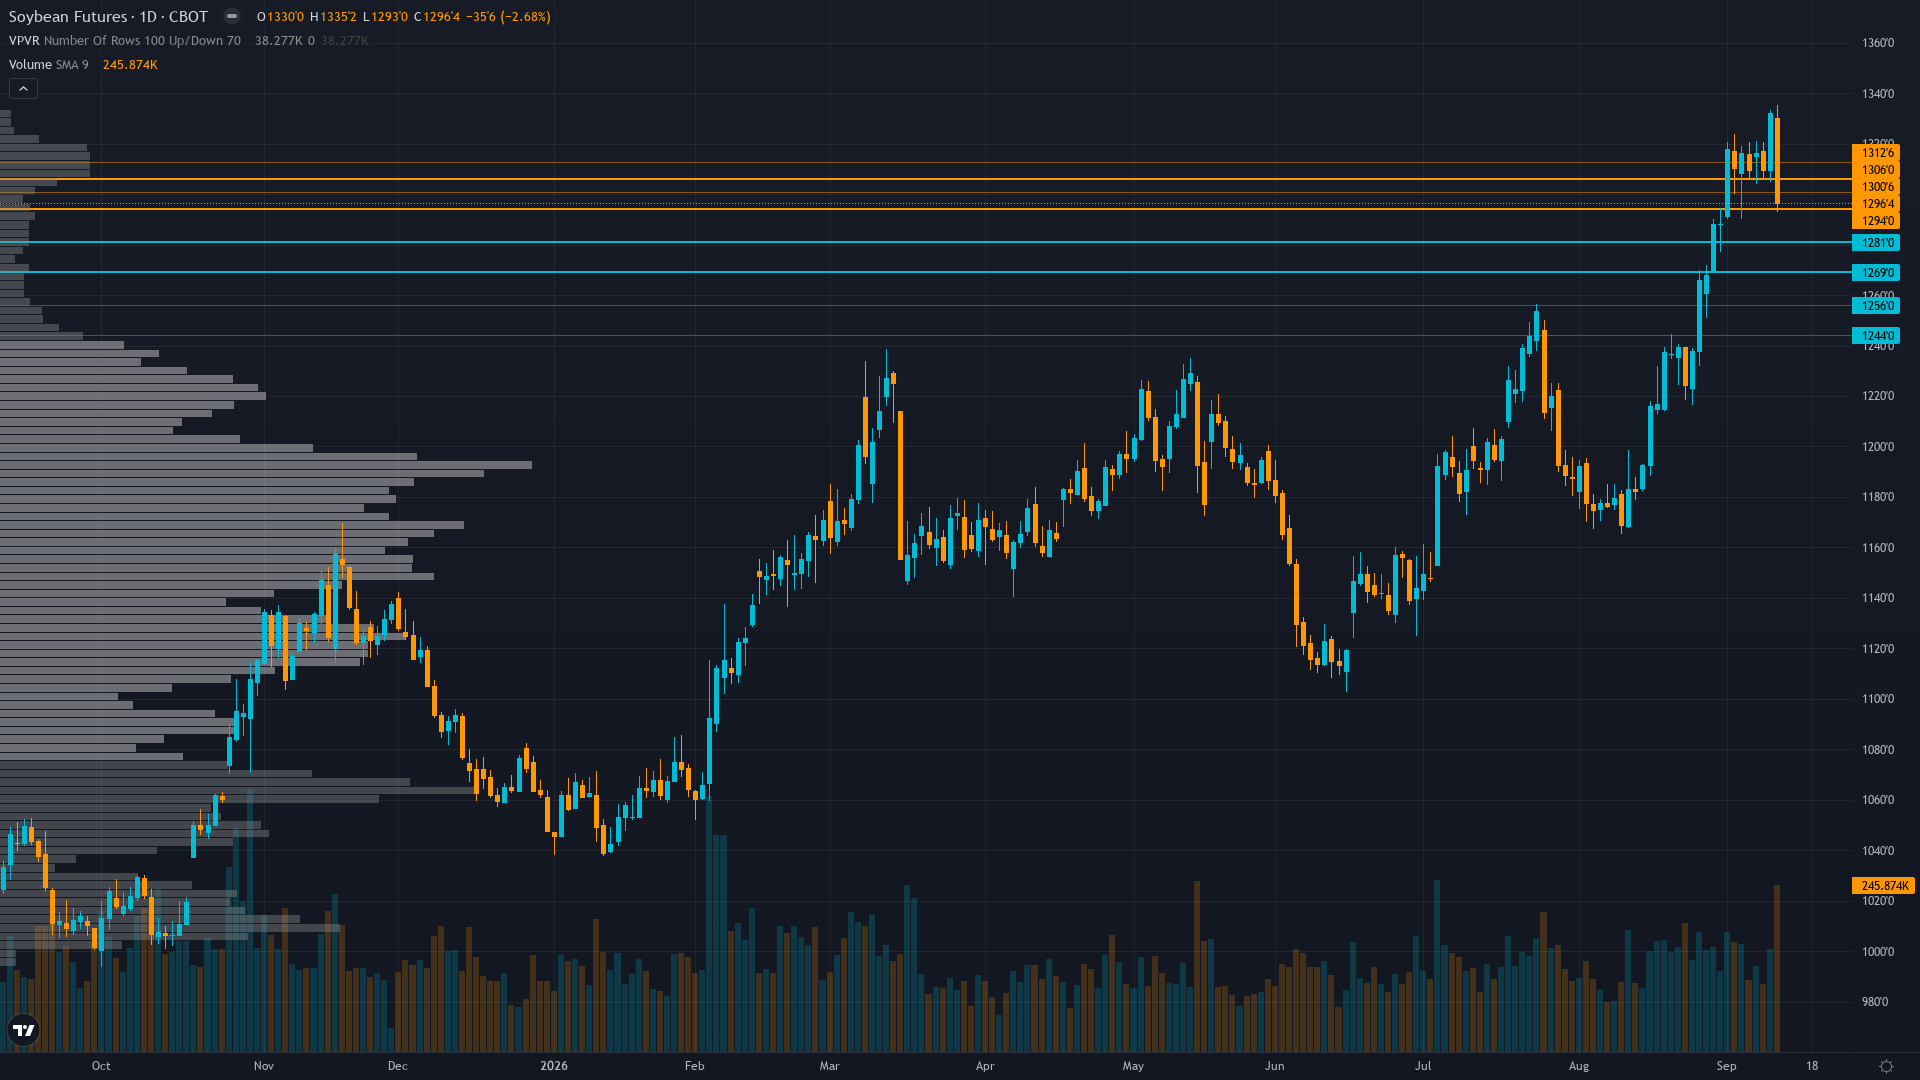
At 1280.25, soybeans has eased 0.41% in a controlled retreat. The market in soybean futures is coiling, with narrowing price ranges suggesting stored energy that will eventually release.
Price at 1280.25 consolidating below 52-week high of 1335.13 after WASDE-driven selloff; daily trend bullish from August rally but momentum stalling, RSI likely declining from overbought, price retreating from September 11 breakdown below 1296 support; key test at 1250-1275 zone as harvest pressure builds
Trend strength sits at 5/10, reflecting moderate directional pressure without clear dominance.
Downside Protection
The downside architecture for ZS futures features support zones rooted in prior buying activity. These are not arbitrary lines but areas where real capital has previously been committed.
The reliability of support under trending down with reversal signal post-WASDE conditions is shaped by the interplay between volatility regime and historical volume at each level.
Resistance Zone Context
The upside path for soybean price is marked by resistance zones where prior selling activity created structural barriers. Clearing these zones requires either strong momentum or a shift in the fundamental picture.
In the current market state, resistance zones remain key decision points.
Analytical Convergence
The most actionable levels for soybeans are those where multiple analytical disciplines converge. When technical structure, institutional positioning, and options flow all point to the same zone, the probability of price reacting there increases meaningfully.
Current normal volatility at 65th percentile suggests 25-35 cent daily ranges expanding toward 40-55 cents as liquidation risk builds; post-WASDE price discovery below 1296 level creates elevated false-breakout risk near the 1250-1280 zone; standard stop placement widened to 30-40 cents; asymmetric gap risk on speculative liquidation cascade if 1250 support breaks
Our Multi-Agent Approach to Key Levels
The levels in our paid reports are generated by six specialist agents working in parallel. Technical analysis provides the structural framework, institutional data shows where capital is committed, options flow reveals hedging behaviour, fundamentals anchor levels to value, sentiment gauges crowd positioning, and economic analysis times the catalysts.
The output is a curated set of levels with institutional-grade validation — the kind of multi-dimensional analysis that hedge fund research desks produce, delivered at a fraction of the cost.
Our paid reports include specific support and resistance levels identified by six specialist agents — technical structure, institutional positioning, options flow, fundamentals, sentiment, and economic analysis. Not just lines on a chart, but zones validated by multi-discipline confluence.
Start Free — Get the Market of the WeekFree weekly report · No credit card · Upgrade anytime


