Soybeans Forecast This Week — Outlook, Drivers & Key Levels
This week's Soybeans outlook: key drivers, volatility context, risk-opportunity assessment and the week ahead.

Market Overview
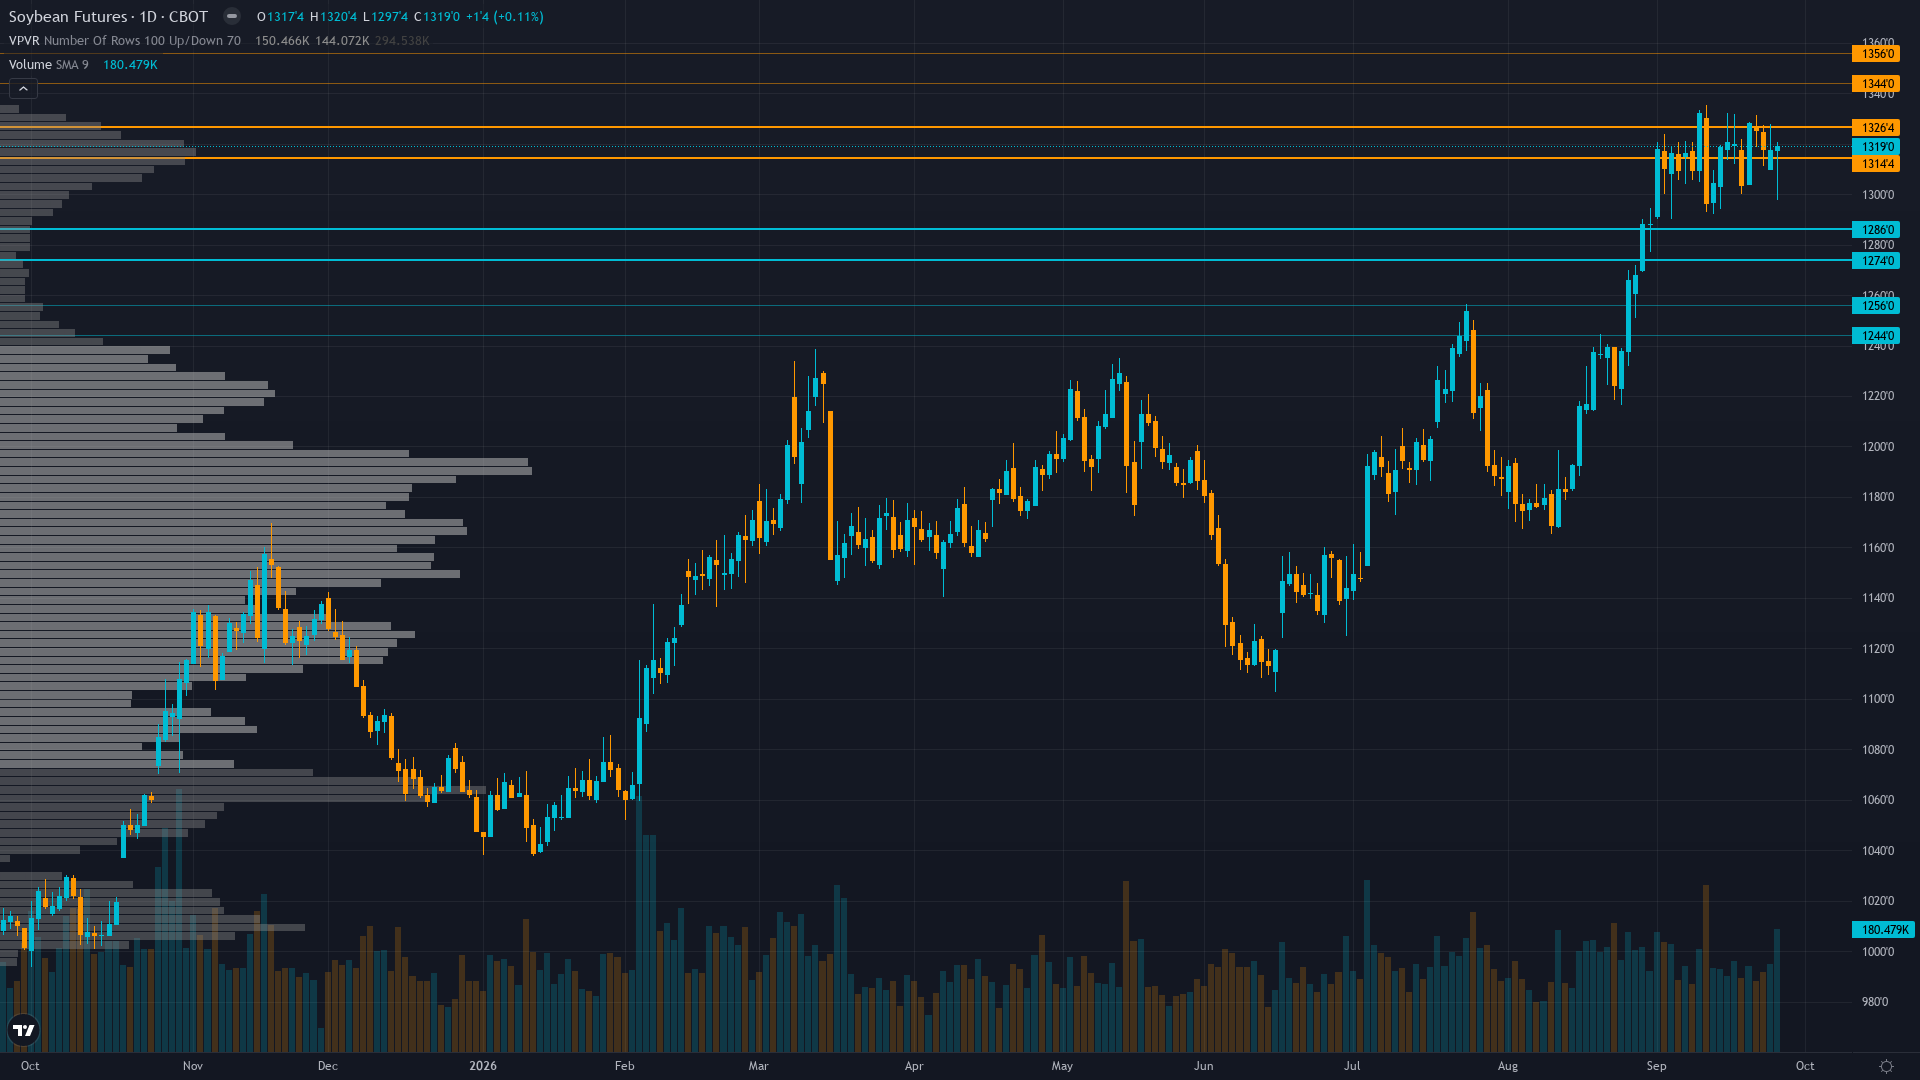
At 1319, soybeans has inched 0.31% higher in a measured advance. soybean futures is range-bound and tightening, with decreasing volatility signalling a directional resolution ahead.
Market sharply divided between near-term bulls citing rain-delayed harvest creating spot supply crunch, soymeal backwardation, and processor scramble for beans, versus positioning bears warning that 99.4th percentile speculative net longs (281,581 contracts) at the 3-year maximum combined with pre-Grain Stocks binary event risk and eventual harvest acceleration create asymmetric downside vulnerability
This Week's Catalysts & Drivers
Primary driver: Record September rainfall across the western Midwest is delaying the US soybean harvest, tightening spot supplies, forcing processors to offer hefty premiums for immediate deliveries, and inverting the soymeal futures curve (October life-of-contract high, trading at premium to December for first time in over two years per Reuters Sep 24-25)
Secondary factor: Extreme institutional positioning at the 99.4th percentile of the 3-year range: CFTC COT September 22 shows non-commercial net long at 281,581 contracts (the absolute 3-year maximum), up +20,398 contracts weekly, with commercial hedgers net short -257,544 contracts — creating acute vulnerability to forced liquidation if the rain pattern breaks and harvest accelerates
Additional influence: USDA Quarterly Grain Stocks report scheduled for September 30, 2026 (3 days away) is a high-impact binary event that will resolve actual on-farm stocks versus expectations (~324M bushels consensus), with the rain-delayed harvest potentially depressing old-crop usage and creating a surprise in either direction
Economic backdrop: TRANSITIONAL macro regime: VIX at 16.34 below fear threshold, HY credit spreads at 266bp tightening, but US Treasury yields rising sharply (10Y at 5.17%, up 16bp in 1 week) strengthening the USD and creating export competitiveness headwinds for US soybeans against Brazilian competition; Fed still at 3.63% with no near-term pivot expected
Fundamental assessment: The supply-side picture has been transformed THIS WEEK by persistent Midwest rains delaying harvest — processors scrambling for supply, basis premiums surging, soymeal futures in backwardation — but the structural WASDE September bearishness (52.8 bpa yield, 4.535B bushels production, 310M ending stocks) remains unresolved and will assert once drier weather returns
Technical Picture
Price at 1319 consolidating near the 52-week high of 1328, trading well above both 50-day (~1250) and 200-day (~1150) moving averages, with RSI elevated but not overbought at ~65-70; the double-top rejection at 1320-1328 area (failed on Sep 11 and Sep 25) creates a potential resistance ceiling that must break for continuation
At 6/10, trend strength indicates a solid directional lean without being overextended.
Bull & Bear Case
Primary risk: The extreme speculative net long at the 99.4th percentile (281,581 contracts) represents the single largest positioning extreme in the dataset — if drier weather returns next week and harvest accelerates, the resulting supply flow will hit a market with no remaining speculative buying capacity and record commercial short hedging, potentially triggering a violent liquidation cascade toward 1250-1296 support representing 3-5% downside amplified by crowded long exit (Probability: medium)
Primary opportunity: Persistent Midwest rainfall delaying harvest into October could keep spot supplies tight through the September 30 Grain Stocks report, potentially surprising to the downside on old-crop stocks (less consumption as new-crop supply delayed), supporting a breakout above 1328 resistance toward 1350 representing 2-4% upside as processors continue bidding aggressively for immediate supplies and soymeal backwardation incentivizes bean buying (Timeframe: Next 1-2 weeks through September 30 Grain Stocks report and October 9 WASDE; the harvest delay is a weather-dependent catalyst that will resolve based on when drier conditions return to the western Midwest)
This week's edge: The market is pricing the rain-delayed harvest as a bullish catalyst driving spot premiums and soymeal inversion, but is NOT pricing the full risk that this is a temporary weather delay — the soybeans remain in the fields, and once a drier window opens, harvest will accelerate rapidly, hitting a market where speculative net longs are at the absolute 3-year maximum with no remaining capacity for additional buying, creating an asymmetric setup where the harvest delay provides near-term support but the positioning extreme represents a structural reversal risk that the current rally is underweighting; the pre-USDA Grain Stocks report binary event prevents conviction on either side
Volatility Regime
Volatility for soybean price is at the 68th percentile over 90 days — a normal regime that allows for standard position sizing and conventional trade management. The volatility trend is up, with expansion across timeframes pointing to growing uncertainty in near-term price action.
Current normal volatility at 68th percentile suggests 25-35 cent daily ranges expanding toward 40-55 cents as Grain Stocks report approaches; the 1328 resistance level creates elevated false-breakout risk; soymeal backwardation adds complexity to crush spread positioning; standard stops widened to 35-40 cents given the binary event risk on September 30 and the potential for weather-driven gap moves
What to Watch
The USDA Quarterly Grain Stocks report estimating September 1, 2026 on-farm and off-farm soybean stocks; consensus expectation ~324 million bushels; this is the first official data point for actual 2026 harvest quantities and will either confirm or contradict the September WASDE production estimate of 4.535B bushels on Wednesday 30 September stands as the week's primary risk event — high-impact and capable of overriding the existing technical and sentiment setup.
The interplay between consolidating market conditions and upcoming catalysts will define this week's trading landscape for CBOT soybeans.
This analysis covers one dimension. Our full weekly report combines six specialist agents into a single actionable briefing with directional bias, key levels, and risk-opportunity matrix.
Start Free — Get the Market of the WeekFree weekly report · No credit card · Upgrade anytime


