Soybeans Forecast This Week — Outlook, Drivers & Key Levels
This week's Soybeans outlook: key drivers, volatility context, risk-opportunity assessment and the week ahead.

Current Market Picture
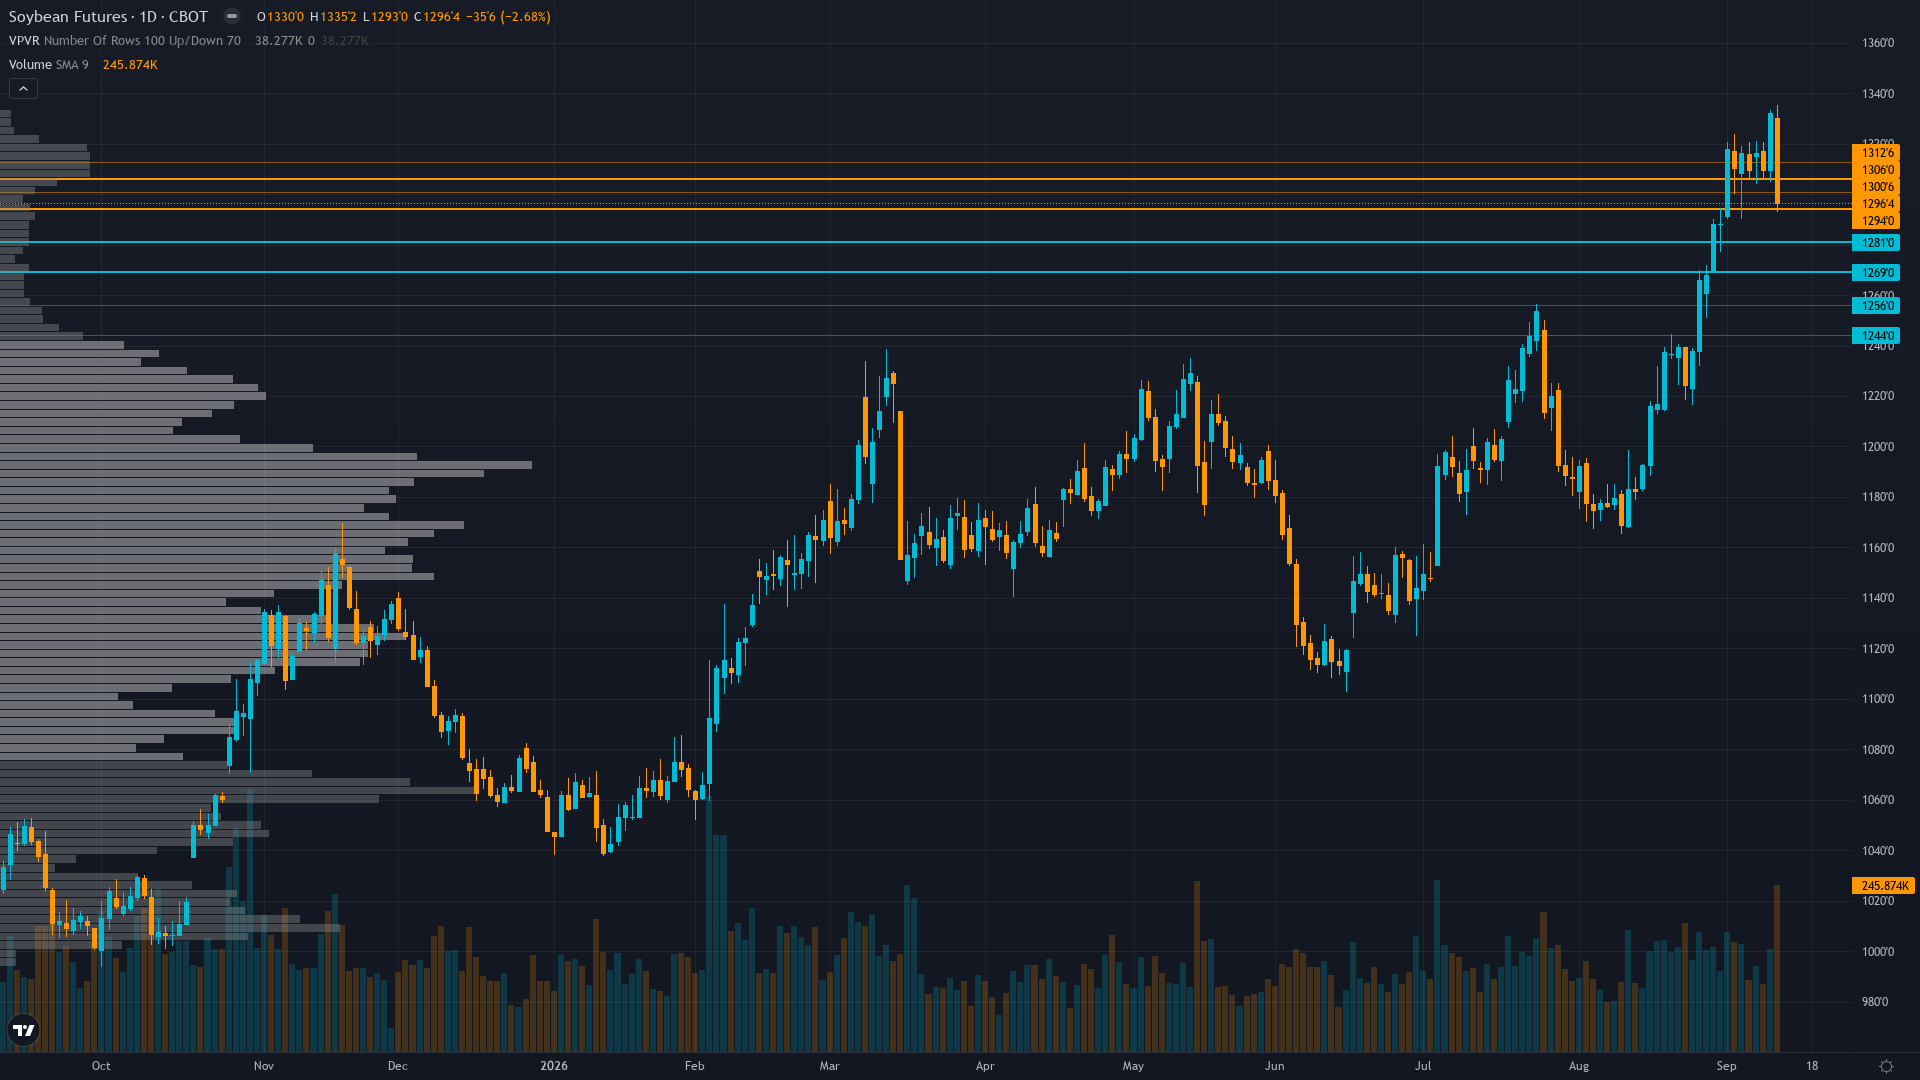
soybeans is trading at 1280.25, down 0.41% in a measured pullback. The market in soybean futures is coiling, with narrowing price ranges suggesting stored energy that will eventually release.
Post-WASDE bearish lean as market digests supply-side disappointment: yield increased above expectations breaking the tight-supply narrative that drove August rally, with extreme speculative positioning at 99.4th percentile creating acute liquidation vulnerability, though crop conditions at 58% G/E and China demand provide competing support that prevents outright panic selling
Risk & Opportunity
Primary risk: Speculative long liquidation cascade from extreme 99.4th percentile positioning (273,424 contracts) now that September WASDE failed to validate bullish tight-supply thesis — at the 3-year maximum with no room for additional buying, the only positioning pathway is reduction, and the bearish WASDE surprise combined with seasonal harvest pressure creates a powerful catalyst for forced unwinding toward 1200-1250 support representing 3-5% downside with cascading liquidation amplification (Probability: high)
Primary opportunity: Crop condition deterioration to 58% G/E (7 points below year-ago) provides genuine supply-side uncertainty that WASDE yield at 52.8 bpa may still prove too optimistic as harvest results reveal actual yield damage from summer drought, combined with sustained Chinese export buying at 136K MT confirmed September 11 and renewable diesel structural demand at 2.78B bushels providing demand floor that could support a recovery bounce toward 1316-1335 resistance if liquidation stabilizes (Timeframe: Next 2-4 weeks through September 30 Grain Stocks report and early October WASDE, with weekly harvest yield results providing incremental supply resolution)
This week's edge: The market has not yet priced in the full implications of extreme institutional positioning at the 3-year maximum (273,424 contracts non-commercial net long) now that the WASDE catalyst has failed to validate the bullish thesis — with seasonal harvest pressure (Sep-Nov typically weak) beginning and all six WASDE headline numbers coming in above consensus, the asymmetry strongly favors a mean-reverting liquidation event toward 1200-1250 that the current price consolidation near 1280 still underweights; the measured per-discipline accuracy data (Section 2A) shows Institutional at 55% and Fundamental at 52% in COMMODITY — the extreme positioning signal from our most reliable bearish voice (Institutional at 55%) deserves full weight against the now-stale bullish fundamental narrative that the WASDE has just contradicted
What's Driving Price
Primary driver: September 11 WASDE delivered a bearish supply-side surprise — soybean yield raised to 52.8 bpa (above 52.4 trade estimate and 52.7 August), production at 4.535B bushels (above 4.501B expected), and ending stocks at 310M (above 290-298M consensus), breaking the prior bullish narrative of tightening supply and triggering a -1.52% selloff on report day
Secondary factor: Extreme institutional positioning at 99.4th percentile of 3-year range: CFTC COT September 8 shows non-commercial net long at 273,424 contracts (up 25,437 weekly) at the absolute 3-year maximum, creating acute asymmetric vulnerability to forced long liquidation as harvest pressure begins and WASDE data fails to validate bullish thesis
Additional influence: Seasonal harvest pressure begins — soybeans typically weak September-November as US harvest progresses, with 13% already dropping leaves as of August 30 and harvest commencing in early-mid September, creating fundamental supply-side headwind that amplifies speculative liquidation risk from extreme positioning
Economic backdrop: TRANSITIONAL macro regime: VIX at 16.34 below 20 fear threshold, equity markets holding, but USD supported by 10Y Treasury at 4.96% (up 18bp in 1 week) creating export competitiveness headwinds; Fed expectations shifting toward September rate hike with FOMC Economic Projections on September 16 key catalyst; inflation at 2.36% contained but above target preventing dovish pivot
Fundamental assessment: Supply-side bearish surprise from September WASDE: yield raised to 52.8 bpa (above trade expectations), production 4.535B bushels, ending stocks 310M weaker than consensus 290-298M — looser balance sheet than anticipated breaks the tight-supply narrative that drove the August rally; crop conditions 58% G/E still below average but yield estimate surprised to the upside, suggesting conditions may be less damaging than feared
Chart Assessment
Price at 1280.25 consolidating below 52-week high of 1335.13 after WASDE-driven selloff; daily trend bullish from August rally but momentum stalling, RSI likely declining from overbought, price retreating from September 11 breakdown below 1296 support; key test at 1250-1275 zone as harvest pressure builds
With trend strength at 5/10, the directional signal is present but far from decisive.
Volatility Context
At the 65th percentile, soybean price volatility sits in a normal range, neither compressed enough to signal a breakout nor elevated enough to demand caution. Realised vol is trending higher across the curve, which tends to accompany transitional periods where the market is repricing risk.
Current normal volatility at 65th percentile suggests 25-35 cent daily ranges expanding toward 40-55 cents as liquidation risk builds; post-WASDE price discovery below 1296 level creates elevated false-breakout risk near the 1250-1280 zone; standard stop placement widened to 30-40 cents; asymmetric gap risk on speculative liquidation cascade if 1250 support breaks
Week Ahead Outlook
FOMC Economic Projections and Rate Decision with potential September hike implications for USD strength and commodity demand on Wednesday 16 September is the next scheduled catalyst, with moderate potential to influence near-term price action.
For ZS futures, the balance between existing momentum and scheduled risk events sets the stage for the week ahead.
This analysis covers one dimension. Our full weekly report combines six specialist agents into a single actionable briefing with directional bias, key levels, and risk-opportunity matrix.
Start Free — Get the Market of the WeekFree weekly report · No credit card · Upgrade anytime


