Soybeans Forecast This Week — Outlook, Drivers & Key Levels
This week's Soybeans outlook: key drivers, volatility context, risk-opportunity assessment and the week ahead.

This Week's Starting Point
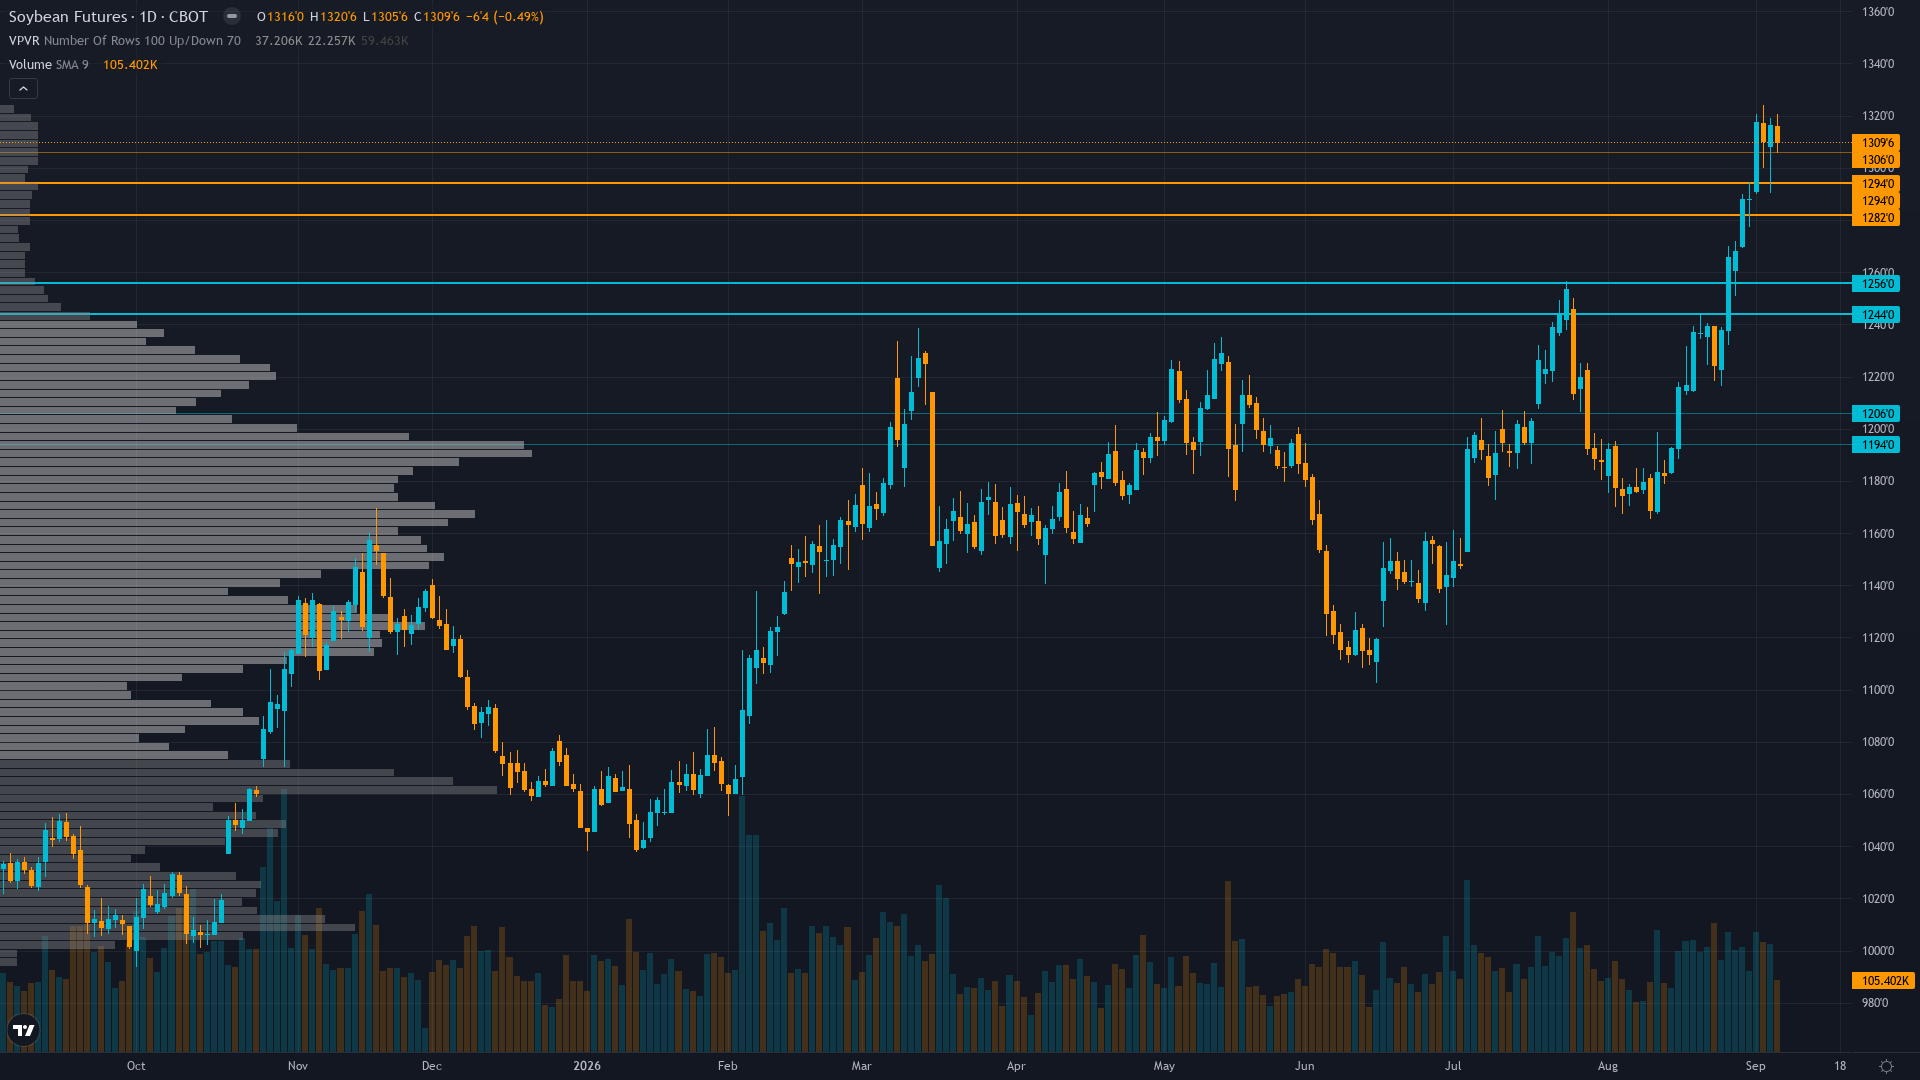
soybeans is trading at 1293.75, down 0.92% in a measured pullback. Price action in soybean futures has compressed into a consolidation pattern, typically a precursor to a directional breakout.
Mixed with bullish fundamental tone tempered by extreme positioning risk: market recognizes tight supply-demand and robust Chinese demand but 98.7th percentile speculative net long creates acute vulnerability ahead of September 11 WASDE yield resolution that could trigger sharp two-way volatility
Forces in Play
Primary driver: Extreme speculative long positioning at 98.7th percentile (247,987 contracts net long) creates acute contrarian vulnerability ahead of September 11 WASDE binary event, completely offsetting otherwise bullish fundamental and technical convergence
Secondary factor: Crop conditions deteriorating to 58% good-to-excellent as of August 30 (down from 61% two weeks prior and 63% in early August), with Brugler500 index falling 4 points to 353, tightening supply outlook during late pod-fill and early maturity
Additional influence: September 11 WASDE report 5 days away represents critical binary catalyst where yield resolution (Pro Farmer 53.3 BPA vs USDA 52.7 BPA) will determine whether extreme speculative longs are rewarded or liquidated violently
Economic backdrop: RISK-ON macro regime: VIX at 16.34 below 20 fear threshold, equity markets trending higher, Treasury curve steepening at 2s10s +41bp, Fed funds at 3.63% on hold, inflation at 2.35% contained supporting risk appetite for commodities
Fundamental assessment: Supportive with tight supply-demand: crop conditions at 58% G/E well below historical averages, Chinese demand robust with 192K MT flash sales September 3, but USDA September WASDE expected to show near-unchanged or modestly higher ending stocks if yield estimate raised per Grain Market Insider survey expectations
Technical Landscape
Price at 1293.75 in upper 95.7% of 52-week range, trading above 50-day and 200-day moving averages, rejecting at 1300 psychological resistance with 1306.75 as 52-week high; RSI likely overbought but trend structure remains bullish with elevated volume
Trend strength registers at 6/10, suggesting meaningful but not extreme directional bias.
Risk-Reward Assessment
Primary risk: Extreme speculative positioning at 98.7th percentile (247,987 contracts non-commercial net long) creates acute asymmetric downside risk: if September 11 WASDE confirms higher yields (Pro Farmer 53.3 BPA vs USDA 52.7 BPA), forced long liquidation from near-record levels combined with seasonal harvest pressure (September-November typically weak) could trigger a sharp correction toward 1250-1275 support representing 3-5% downside (Probability: medium)
Primary opportunity: Further crop condition deterioration below 58% G/E or sustained Chinese demand momentum (192K MT flash sales September 3 plus ongoing 25 MMT annual commitment framework) combined with September WASDE validating lower yields could drive price through 1300 psychological resistance toward 1320-1350 representing 3-5% upside with trend-following amplification (Timeframe: Next 1-2 weeks through September 11 WASDE release and initial post-report price discovery)
This week's edge: Signal magnitude near zero falls below 1.0 minimum threshold for AGRICULTURAL directional bias per Rule 2, mandating NO CALL despite strong individual discipline signals, as extreme institutional bearishness at 98.7th percentile (247,987 contracts contrarian signal with 55% measured accuracy) almost exactly offsets fundamental and technical bullishness (52% and 53% accuracy respectively), creating genuine analytical paralysis where the market faces balanced two-way risk through the September 11 WASDE binary event with no directional edge resolvable at current levels
Risk Environment
With vol at the 65th percentile over 90 days, soybean price is in a measured regime that doesn't require unusual adjustments. Volatility is stable, with realised vol holding steady across timeframes. This equilibrium can persist but eventually resolves into expansion or contraction.
Current normal volatility at ~65th percentile suggests 25-35 cent daily ranges approaching WASDE; false breakout risk elevated near 1300-1306 resistance zone given extreme positioning and pre-report positioning adjustments; standard stops widened to 30-35 cents; asymmetric gap risk on WASDE binary outcome
Looking Forward
All eyes turn to USDA September WASDE report updating 2026/27 supply-demand estimates with critical first field-measurement-based yield projections resolving Pro Farmer 53.3 BPA vs USDA August 52.7 BPA discrepancy on Friday 11 September, which carries enough weight to force a decisive directional move.
The week ahead for soybean futures hinges on whether the prevailing consolidating regime can absorb the scheduled catalysts without a regime shift.
This analysis covers one dimension. Our full weekly report combines six specialist agents into a single actionable briefing with directional bias, key levels, and risk-opportunity matrix.
Start Free — Get the Market of the WeekFree weekly report · No credit card · Upgrade anytime



