Soybeans Forecast This Week — Outlook, Drivers & Key Levels
This week's Soybeans outlook: key drivers, volatility context, risk-opportunity assessment and the week ahead.

Current Market Picture
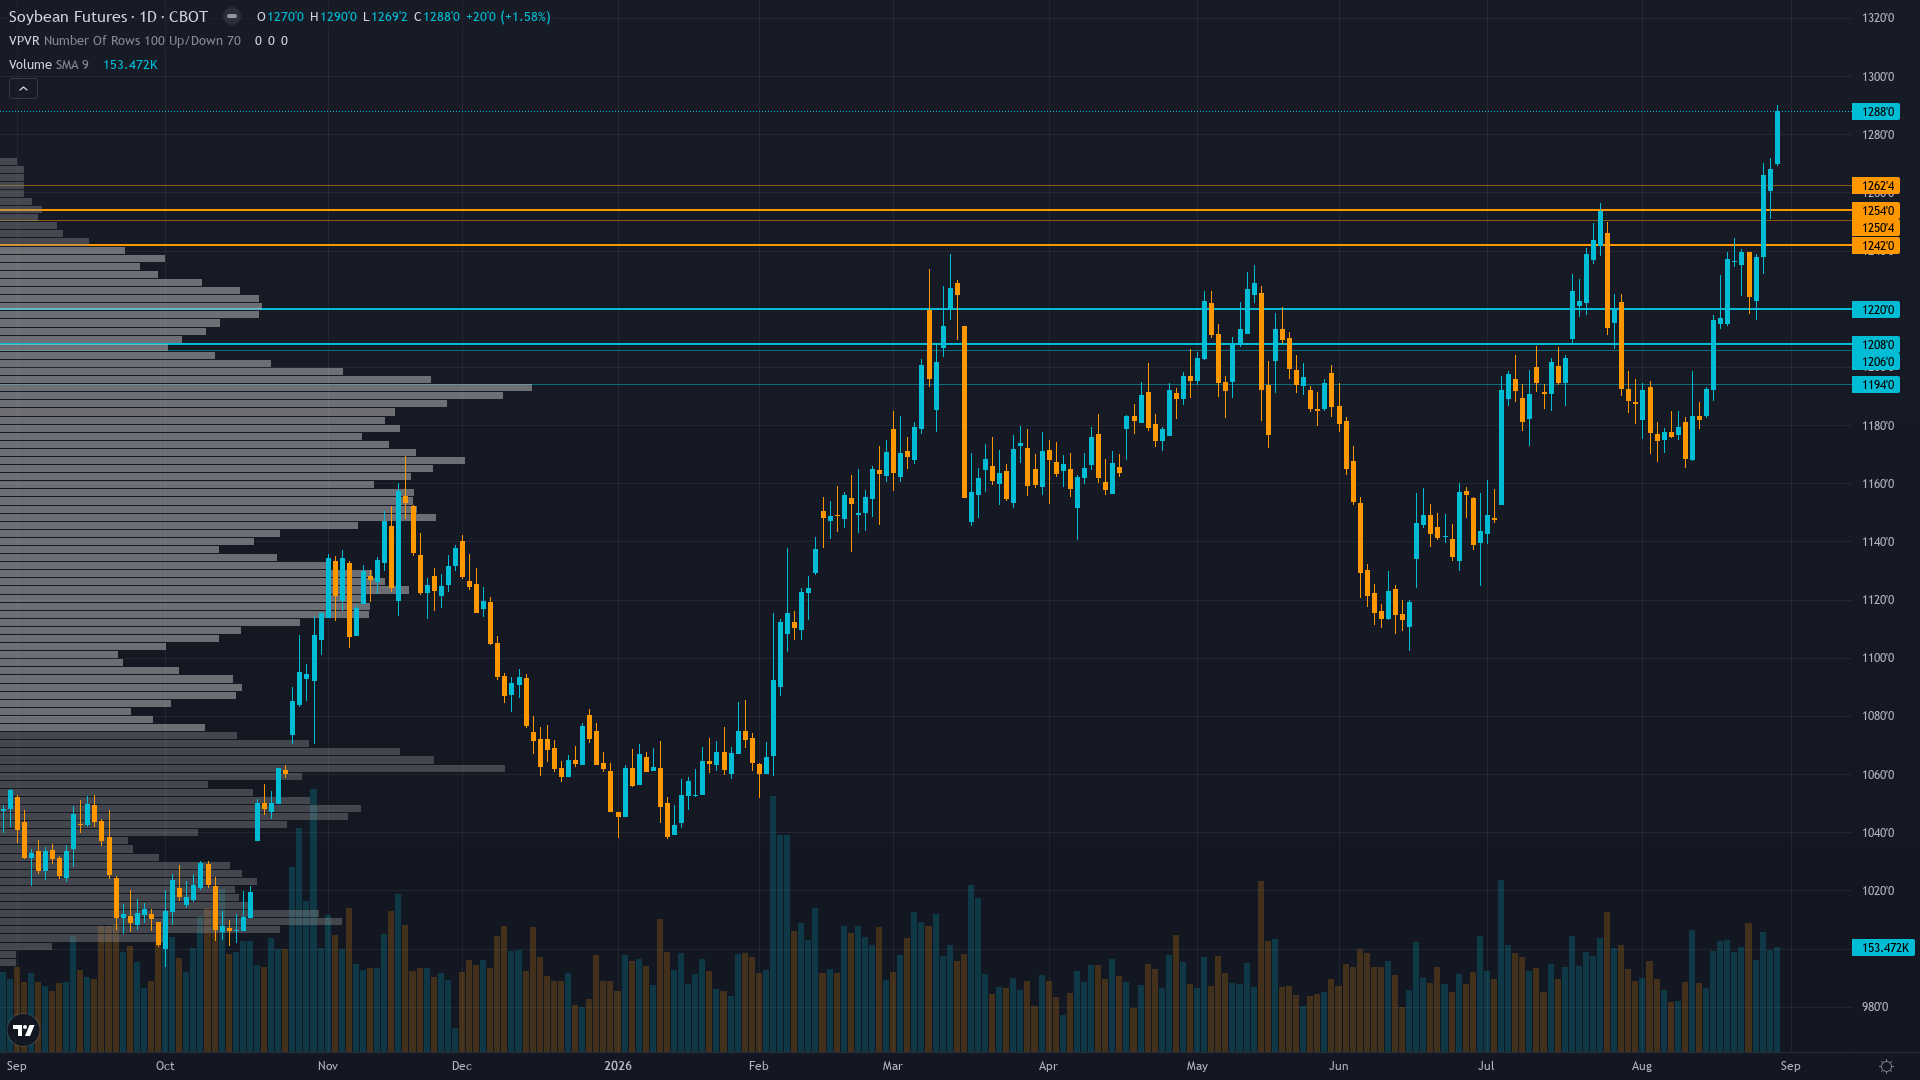
soybeans is trading at 1276.25, essentially flat as the market digests recent moves. Directional momentum continues to define soybean futures, with the trend firmly in control of price action.
Bullish with positioning risk: market consensus acknowledges powerful demand-side catalyst from Chinese buying and tightening supply from declining crop conditions, but extreme speculative net long at 93.7th percentile creates vulnerability ahead of September 11 WASDE binary event where Pro Farmer's 53.3 BPA yield estimate versus USDA's 52.7 BPA will be resolved
Key Drivers This Week
Primary driver: Explosive Chinese demand driving record export sales: USDA confirmed new-crop soybean sales topped 90 million bushels for week ending August 20, with China accounting for ~40.5 million bushels and over 80% of total new-crop sales, validating trade normalization under the 25 MMT annual commitment framework and creating a powerful demand-side catalyst that has overwhelmed seasonal harvest pressure expectations
Secondary factor: Declining crop conditions provide supply-side support: USDA Crop Progress August 24 shows soybean good-to-excellent ratings deteriorated to 61% (down from 63% two weeks ago and 66% in early August), with Farm Progress reporting August 25 that quality ratings eased another point to 60% good-to-excellent, tightening the supply outlook during late pod-fill and reducing expected yield potential ahead of the September 11 WASDE
Additional influence: Speculative positioning at extreme 93.7th percentile of 3-year range: CFTC COT August 25 shows non-commercial net long surged 30,466 contracts to 221,427 contracts, representing 22.8% of open interest and reaching near-record levels, creating asymmetric risk of long liquidation but reflecting genuine institutional conviction in the demand-driven rally as commercial hedgers increase short coverage into harvest at -199,936 contracts
Economic backdrop: RISK-ON macro regime: VIX at 14.2-15.1 well below 20 fear threshold, equity markets near record highs, credit spreads tightening at 275bps supporting risk appetite across commodities; USD stable with Treasury curve at 2s10s +39bp steepening; Fed at 3.63% expected on hold through year-end with September rate hike probability shifting; inflation at 2.31% contained but sticky enough to prevent dovish pivot; macro backdrop broadly supportive for agricultural commodities with risk appetite elevated
Fundamental assessment: Supportive with tightening supply-demand balance: USDA August WASDE yield cut to 52.7 BPA, crop conditions declining to 60-61% good-to-excellent, record Chinese export buying (90M+ bushels weekly), renewable diesel structural demand floor at 2.75B bushels absorbing 62% of crop; primary risk is Pro Farmer's 53.3 BPA yield estimate (above USDA 52.7) being confirmed by September WASDE
Price Structure
Strongly bullish with price at 1276.25 at fresh 52-week high, trading well above MA-20 (1231), MA-50 (1217), and MA-200 (1158); RSI likely in overbought territory above 70 with strong volume supporting the 4.18% weekly gain and 5.12% last-week gain; breakout above the 1248-1270 resistance zone has established new price discovery territory toward 1300 psychological resistance
With trend strength at 8/10, the prevailing move carries significant force behind it.
Volatility Regime
Volatility for soybean price is at the 65th percentile over 90 days — a normal regime that allows for standard position sizing and conventional trade management. The vol trend is flat, with no meaningful shift across timeframes. Stable vol environments often lull traders before a regime change arrives.
Current normal volatility at ~65th percentile suggests 20-30 cent daily ranges near the upper end of typical agricultural baseline; post-breakout price discovery above 1270 reduces false breakout risk below support; standard stop placement of 25-30 cents appropriate for trend-following between 1250-1300; extreme speculative positioning at 93.7th percentile increases gap risk on any catalyst surprise
Bull & Bear Case
Primary risk: Extreme speculative positioning at 93.7th percentile (221,427 contracts non-commercial net long) creates acute liquidation risk if September 11 WASDE confirms Pro Farmer's higher yield estimate of 53.3 BPA (above USDA 52.7 BPA), combined with seasonal harvest pressure beginning in September-November when prices typically decline, potentially triggering a sharp mean-reversion correction toward 1200-1250 support representing 2-6% downside with crowded long exit amplification (Probability: medium)
Primary opportunity: Continued Chinese demand momentum (90M+ bushels weekly export sales with China >80% share) combined with further crop condition deterioration below 60% good-to-excellent could tighten the balance sheet further, while September WASDE may validate lower yield than Pro Farmer's 53.3 BPA estimate, driving price through 1300 psychological resistance toward 1320-1350 representing 3-6% upside with commodity fund trend-following amplification from extreme speculative positioning (Timeframe: Next 1-3 weeks through September 11 WASDE release with weekly Crop Progress and export sales data providing incremental catalysts)
This week's edge: The market is pricing in a continuation of the current demand-driven rally without adequately discounting the risk that September WASDE confirms Pro Farmer's higher 53.3 BPA yield estimate, which combined with extreme speculative positioning at 93.7th percentile and approaching seasonal harvest weakness (September-November typically bearish) creates asymmetric downside risk that current bullish consensus underweights; the edge lies in recognizing that while the Chinese demand story is genuine and powerful, the positioning extreme at near-record levels means any disappointment in the September WASDE could trigger a violent liquidation that the market is not pricing for
Week Ahead Outlook
USDA weekly Crop Progress report updating soybean crop condition ratings during late pod-fill/early maturity stage as harvest preparation begins, plus weekly export sales confirmation of Chinese buying momentum on Monday 31 August is the next scheduled catalyst, with moderate potential to influence near-term price action.
For ZS futures, the balance between existing momentum and scheduled risk events sets the stage for the week ahead.
This analysis covers one dimension. Our full weekly report combines six specialist agents into a single actionable briefing with directional bias, key levels, and risk-opportunity matrix.
Start Free — Get the Market of the WeekFree weekly report · No credit card · Upgrade anytime



