Soybeans Forecast This Week — Outlook, Drivers & Key Levels
This week's Soybeans outlook: key drivers, volatility context, risk-opportunity assessment and the week ahead.

Current Market Picture
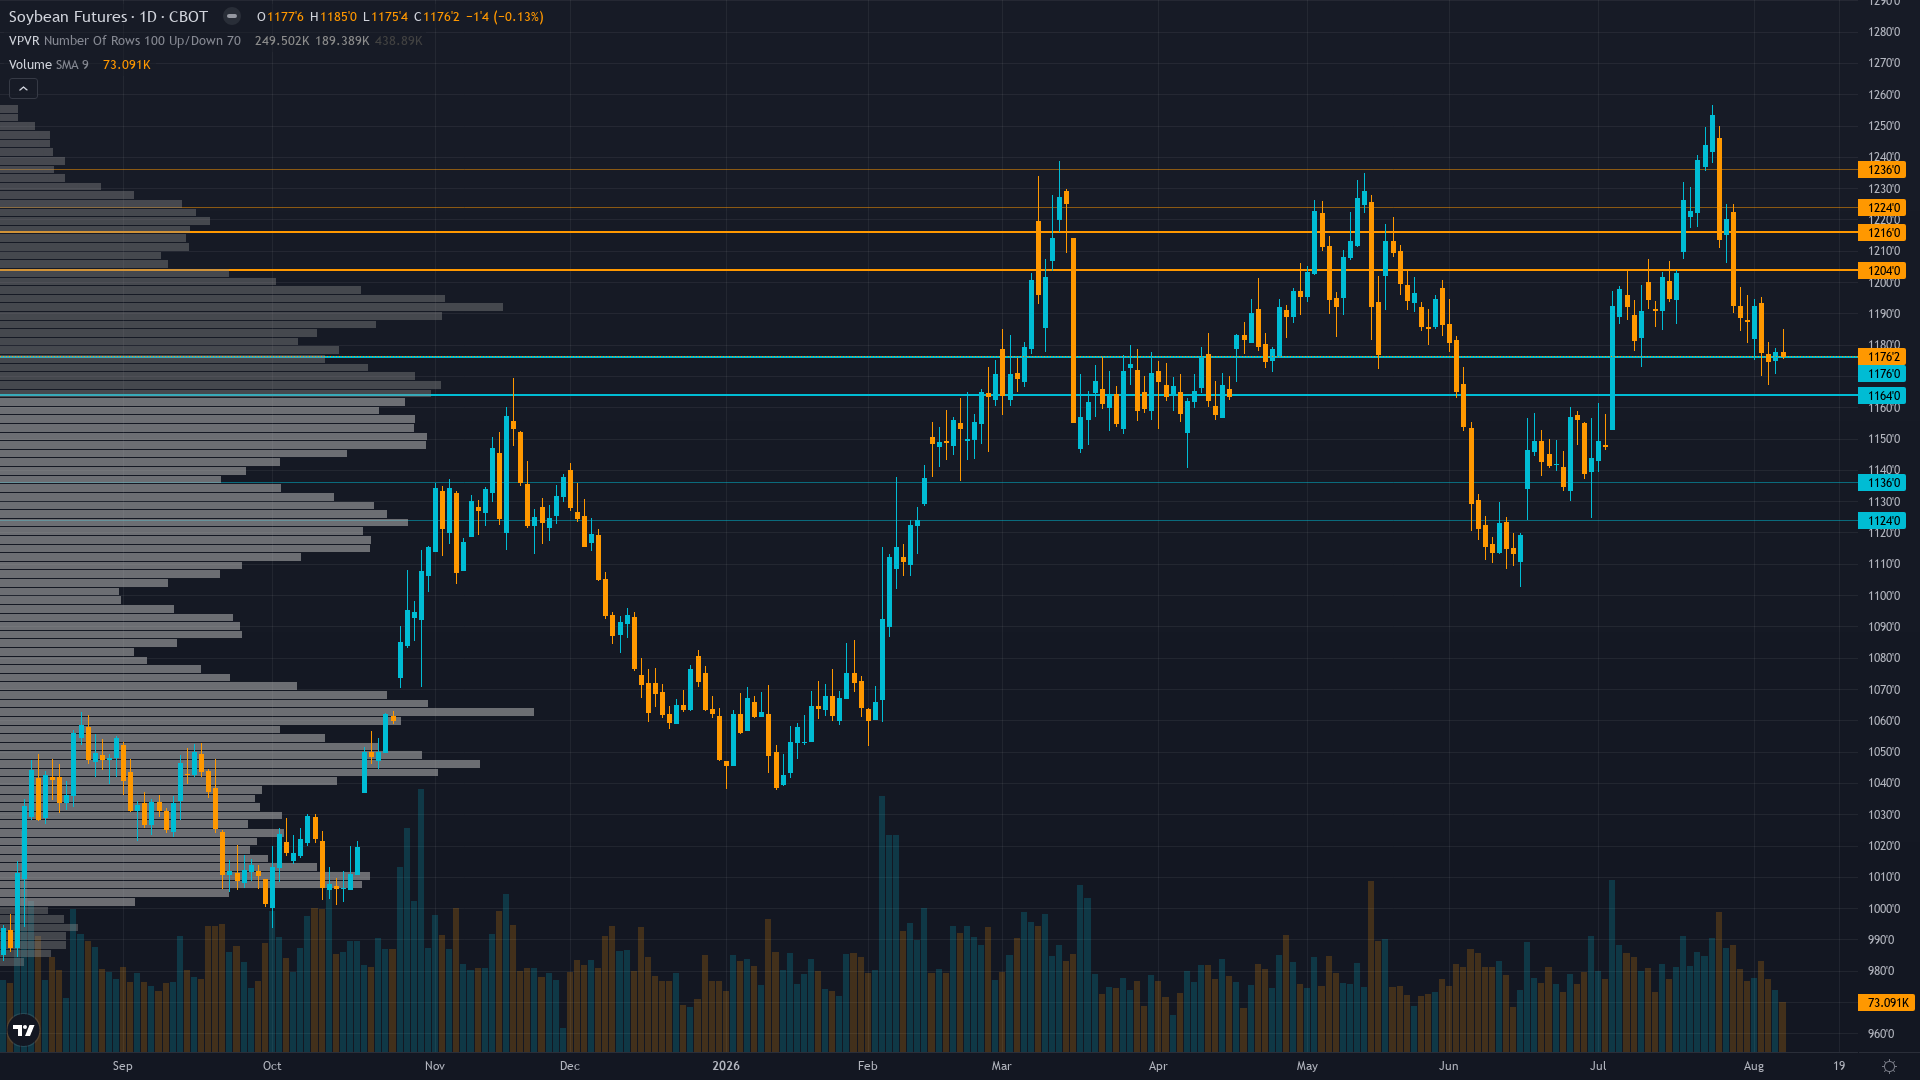
soybeans sits at 1156.5 after slipping 0.24% — a shallow pullback rather than a decisive move. The market in soybean futures is coiling, with narrowing price ranges suggesting stored energy that will eventually release.
Mixed with bearish bias: ample global supply expectation from StoneX 4.47 bbu production estimate and favorable Midwest rain forecast during pod-fill offset by steady 63% G/E crop conditions below analyst expectations, managed money liquidation from elevated 83.5th percentile positioning, and August 12 WASDE binary event creating range-bound consolidation between 1140-1180 with downside bias toward 1100 support if comfortable supply confirmed
Key Drivers This Week
Primary driver: Mandatory Miss Reset triggered: 6 consecutive MISSED calls (Aug 7 -1.79%, Jul 31 -5.13%, Jul 24 +5.99%, Jul 17 +1.76%, Jul 10 +4.36%) far exceeds ZS Miss Reset After threshold of 3, forcing NEUTRAL per Rule 5 for minimum 1 week, compounded by August 12 WASDE binary event 3 days away triggering mandatory -2 conviction penalty per AGRICULTURAL Rule 6
Secondary factor: CFTC COT August 4, 2026 data shows non-commercial net long position at 175,542 contracts (83.5th percentile of 3-year range) with aggressive 36,215 contract reduction from prior week, signaling speculative long liquidation from elevated levels as managed money exits ahead of WASDE uncertainty and weather transition
Additional influence: August 12 WASDE looming in 3 days with StoneX initial 2026 US soybean crop estimate at 53 bpa and 4.47 bbu production, while USDA Crop Progress August 2 shows 63% good-to-excellent conditions steady with prior week but below analyst expectations of 64%, creating binary outcome risk where either comfortable supply confirmation or weather-deteriorated yield could drive 3-5% move
Economic backdrop: TRANSITIONAL macro regime: VIX at 15.15 below fear threshold, HY credit spreads widening to 271 bps, CPI release Aug 12 with YoY estimate 3.4% vs prior 3.5%, DXY strength creating persistent export competitiveness headwinds against Brazilian competition
Fundamental assessment: Soybeans modestly overvalued by 5-7% per fundamental analysis with stable 63% G/E crop conditions, Brazil's projected record 180 MMT production creating surplus pressure, export sales at marketing year lows, but August 12 WASDE could reset balance sheets
Price Structure
Price at 1156.5 below key moving averages in lower third of August range, RSI likely oversold below 40, support 1140 critical with major support at 1100 psychological level, resistance at 1180 (prior swing low turned resistance) and 1200 round number
Trend strength registers just 3/10, which typically corresponds to choppy, directionless price action.
Upside & Downside
Primary risk: August 12 WASDE confirms comfortable US supply outlook with StoneX 53 bpa / 4.47 bbu production forecast validated by favorable August rain across Midwest (NOAA 7-day QPF showing 1-4 inches), triggering further speculative long liquidation from elevated 175,542 contract positioning toward 1100-1140 support representing 3-5% downside with seasonal August weakness pattern reinforcing bearish momentum (Probability: medium)
Primary opportunity: WASDE reveals crop condition deterioration below 63% G/E or lower yield due to warmer/drier-than-normal conditions during critical pod-fill stage combined with sustained China flash sale demand (two flash sales Aug 7 including corn to Mexico and soybeans to China per Farm Progress) tightening global balance sheets, triggering upside toward 1180-1200 resistance (Timeframe: Next 3-10 days through August 12 WASDE release and immediate post-report price discovery period plus resolution of Midwest weather developments during critical pod-fill stage)
This week's edge: Resetting after 6 consecutive misses — thesis under review. The market has whipsawed violently between war/weather-driven breakout to 2-year highs at 1252 and rain-relief collapse to 1156 over the past 3 weeks, demonstrating that no directional thesis can be maintained with confidence through the current August weather transition and WASDE binary event just 3 days away. The fundamental tension between StoneX's comfortable 53 bpa / 4.47 bbu production estimate and the USDA's 63% G/E crop conditions missing analyst expectations of 64% reflects genuine uncertainty about yield potential during pod-fill, while the CFTC COT's elevated 83.5th percentile non-commercial positioning with aggressive 36,215 contract liquidation suggests further downside asymmetry if WASDE validates comfortable supply. The flash sales to China on August 7 provide a demand-side counterweight that prevents complete bearish conviction, but the 6 consecutive misses mandate that the desk step back and reset rather than attempt to call direction into a binary event that has whipsawed us repeatedly
Volatility Context
At the 65th percentile, soybean price volatility sits in a normal range, neither compressed enough to signal a breakout nor elevated enough to demand caution. Realised vol is holding its current level, suggesting the market has found a temporary equilibrium in its risk pricing.
Current normal volatility at 65th percentile suggests 20-30 cent daily ranges versus typical 15-20 cent agricultural baseline, pre-WASDE positioning reducing reliability of technical breakout signals below 1140 or above 1180, false breakout risk elevated during weather-transition periods, standard stop placement widened to 35-40 cents for positioning given August 12 binary event risk
Week Ahead Outlook
The next major catalyst is USDA August WASDE report updating 2026/27 supply-demand balances with critical first comprehensive pod-fill weather impact on yield projections, 2026/27 acreage finalization, and revised global stocks-to-use estimates on Wednesday 12 August — a high-impact event that could materially shift the directional picture.
For ZS futures, the balance between existing momentum and scheduled risk events sets the stage for the week ahead.
This analysis covers one dimension. Our full weekly report combines six specialist agents into a single actionable briefing with directional bias, key levels, and risk-opportunity matrix.
Start Free — Get the Market of the WeekFree weekly report · No credit card · Upgrade anytime



