Soybeans Forecast This Week — Outlook, Drivers & Key Levels
This week's Soybeans outlook: key drivers, volatility context, risk-opportunity assessment and the week ahead.

Where Things Stand
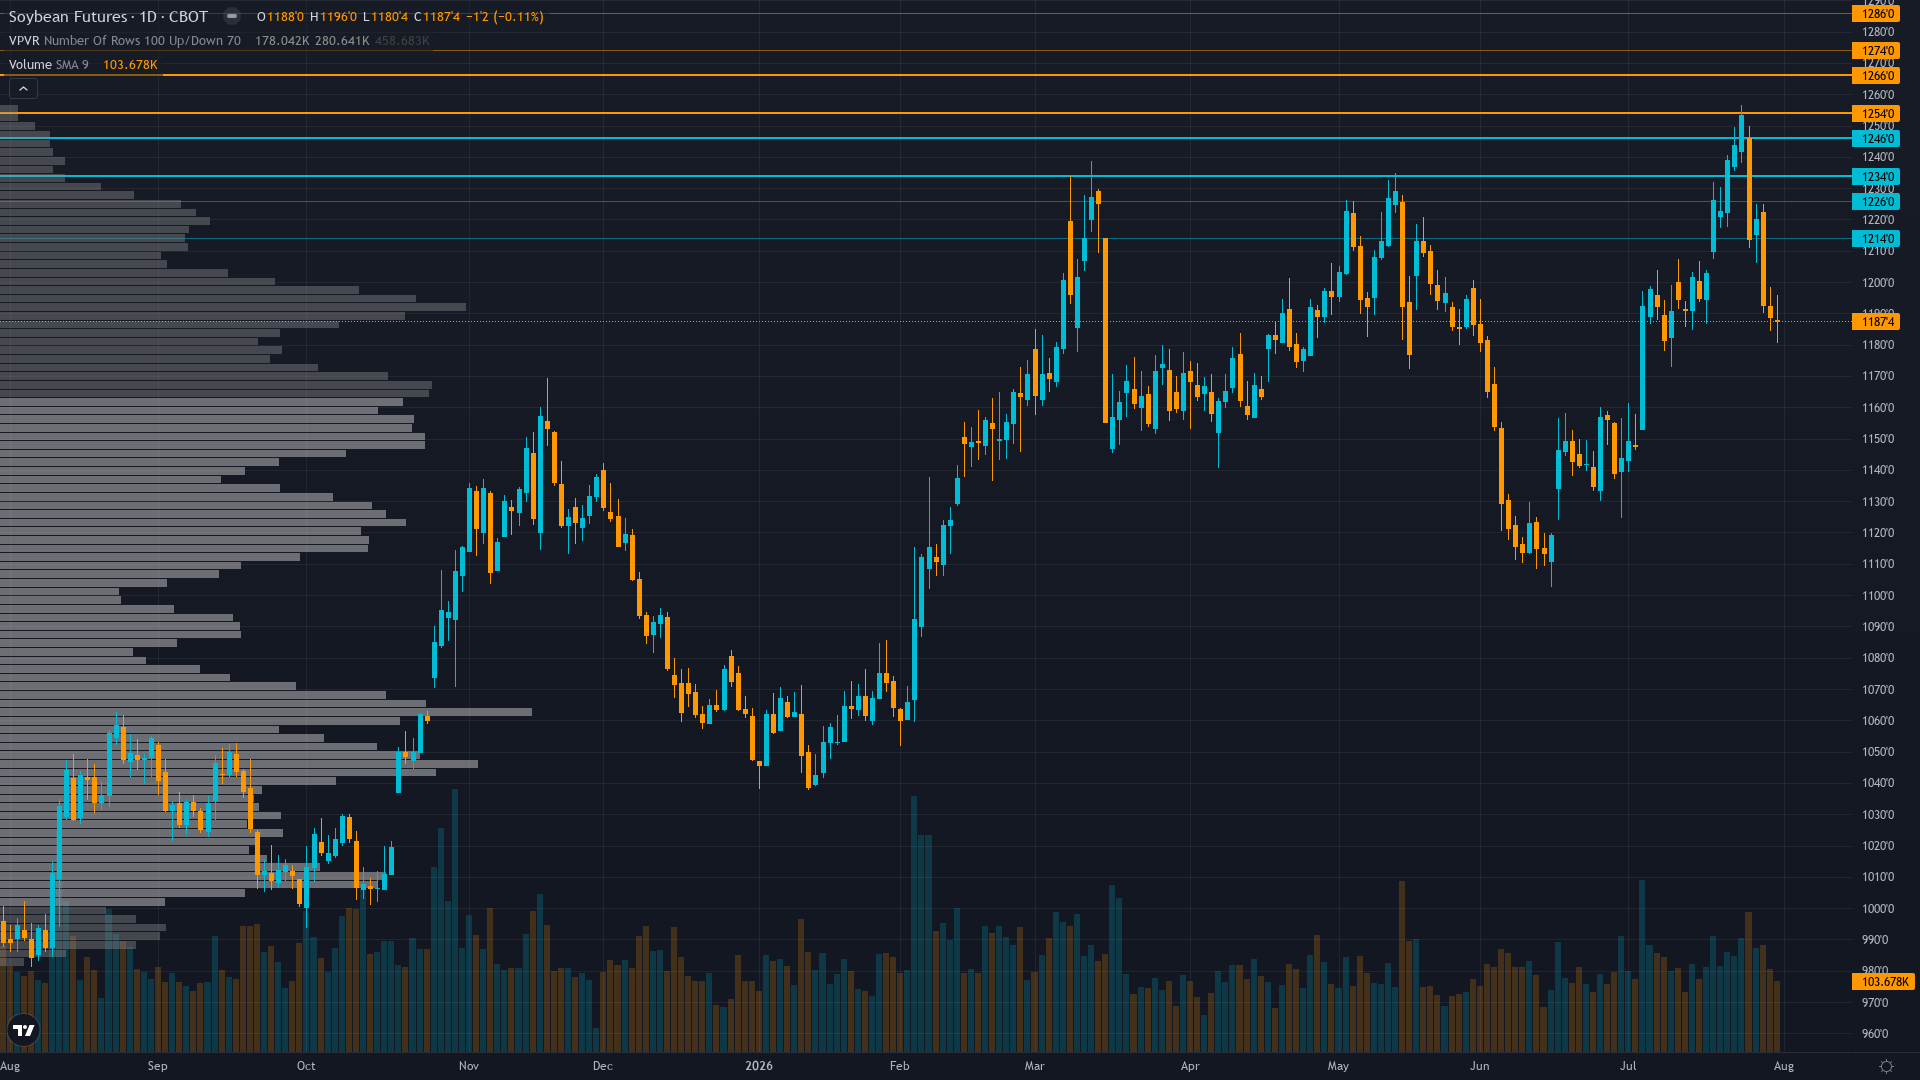
soybeans holds at 1197.38, off 0.55% in a modest retracement from recent levels. soybean futures is consolidating, with price compressing into a narrower range as the market builds energy for its next move.
Mixed with fundamental bulls citing crop condition deterioration to 63% G/E and declining stocks-to-use ratio offset by seasonal bears noting 93% August weakness historical tendency, improved Midwest rain forecasts relieving drought stress during critical pod-fill, and speculator liquidation from large net-long positioning creating range-bound consolidation between 1170-1210 ahead of August 12 WASDE
What's Driving Price
Primary driver: Mandatory Miss Reset triggered: 4 consecutive MISSED calls (July 31 -5.13%, July 24 +5.99%, July 17 +1.76%, July 10 +4.36%) exceeds ZS Miss Reset After threshold of 3, forcing NEUTRAL per Rule 5 for minimum 1 week despite conflicting evidence from weather deterioration to 63% G/E crop conditions and approaching August 12 WASDE binary catalyst
Secondary factor: Post-input development identified from news scan conducted August 2, 2026: Multiple sources confirm material weather and price developments SINCE the July 26 discipline agent inputs — Farm Progress July 31 reports speculators paring down large net-long positions as rain relief and moderating temperatures head for Midwest ahead of critical August pod-fill phase, Yahoo Finance July 27 notes MRCI data showing November soybean contract closed lower on August 6 than July 28 for 14 of past 15 years (93% occurrence) creating powerful seasonal bearish tendency, DTN July 29 reports Corn Belt rain forecast upgraded bringing widespread moisture during critical crop growth stage, and crop conditions slipped from 66% to 63% G/E as of July 26 representing 3-point week-over-week deterioration that could support prices if sustained
Additional influence: Fundamental discipline (row 307, timestamp August 2) signals BULLISH with signal +1.2 confidence 6 on weather stress during critical pod-fill stage, 63% G/E crop conditions down from 66% week-over-week and 70% year-over-year, robust export sales including flash sales to China, but August 12 WASDE scheduled in 10 days creates binary event risk with mandatory pre-USDA-report conviction penalty of -2 per Rule 6 AGRICULTURAL override
Economic backdrop: TRANSITIONAL macro regime with VIX at 18.58 below 20 fear threshold indicating neutral risk appetite, DXY at 101.47 strengthening creating 8-10% export competitiveness headwind versus Brazilian soybeans at $0.80-$1.00 discount, Fed funds at 3.50-3.75% with market pricing 4% by year-end, China recent soybean purchases (264,000 MT May 2026) confirming structural demand but below 25 MMT annual commitment pace
Fundamental assessment: Modestly undervalued at ~$11.97/bushel with declining global stocks-to-use ratio from 29% to 25% (lowest since 2022/23), record renewable diesel demand at 2.75B bushels absorbing 62% of US crop, but crop conditions slippage from 66% to 63% G/E as of July 26 creates yield uncertainty offset by improved Midwest rain forecast supporting average yield potential
Chart Assessment
Neutral-to-mildly-bearish with Investing.com daily buy/sell signal Neutral as of August 2, price trading at 1,197.38 in 1,170-1,220 range after violent -5.13% weekly decline from 1,252.50 broke below both prior breakout level and 20-day MA, today's range 1,195.88-1,224.88 showing attempted recovery but below 1,220 resistance
With trend strength at 4/10, the directional signal is present but far from decisive.
Risk & Opportunity
Primary risk: August 12 WASDE confirms comfortable US production outlook if August weather remains favorable (rain relief materializing as forecasted), combined with speculator liquidation of large net-long positions accelerating as seasonal bearish August tendency (93% historical probability of lower prices early August per MRCI data) forces prices toward 1130-1170 support representing 5-8% downside from current levels (Probability: medium)
Primary opportunity: Continued crop condition deterioration below 60% G/E due to warmer/drier-than-normal conditions persisting during critical August pod-fill stage despite rain relief forecasts, combined with August 12 WASDE confirming further tightening of global stocks-to-use ratio incorporating full July weather impact and robust renewable diesel demand trajectory, triggering rally toward 1210-1230 resistance representing 2-4% upside from current consolidation levels (Timeframe: Next 2-4 weeks through August 3 Crop Progress report, August 10 Crop Progress, and August 12 WASDE binary catalyst resolving weather risk premium and updated supply-demand balance for 2026/27 marketing year)
This week's edge: Resetting after 4 consecutive misses — thesis under review. The market has whipsawed violently between geopolitical war premium and weather-driven breakout to 2-year highs to rain-relief collapse in a 10-day span, demonstrating that no directional thesis can be maintained with confidence through the current August weather transition and WASDE binary event. The 93% historical seasonal tendency for early-August weakness is a powerful underappreciated factor that the market has begun pricing this week, but the crop condition deterioration to 63% G/E introduces genuine yield uncertainty that could override seasonal tendencies if August weather reverts to warmer/drier-than-normal conditions during pod-fill
Volatility Backdrop
soybean price is in a high-volatility environment (75th percentile over 90 days), where position sizing discipline becomes critical. Volatility expansion is underway, suggesting the market is moving into a phase of heightened activity and wider ranges.
Current normal-to-elevated volatility at 75th percentile suggests 25-35 cent daily ranges versus typical 15-20 cent baseline, requiring wider stop placement at 30-40 cents for positioning given the violent whipsaw action of the past 10 days (major support at 1170, resistance at 1210-1220), false breakout risk elevated during weather-transition periods, pre-WASDE positioning reduces reliability of technical breakout signals
The Week Ahead
USDA weekly Crop Progress report Monday August 3 updating soybean crop condition ratings during critical August pod-fill stage, first report incorporating last week's rain relief across Midwest versus ongoing warmer/drier conditions in parts of eastern Corn Belt on Monday 3 August is a high-impact catalyst with the potential to redefine the near-term outlook entirely.
How soybeans navigates the confluence of consolidating conditions and incoming data will determine whether the current directional thesis holds or breaks.
This analysis covers one dimension. Our full weekly report combines six specialist agents into a single actionable briefing with directional bias, key levels, and risk-opportunity matrix.
Start Free — Get the Market of the WeekFree weekly report · No credit card · Upgrade anytime



