Soybeans Forecast This Week — Outlook, Drivers & Key Levels
This week's Soybeans outlook: key drivers, volatility context, risk-opportunity assessment and the week ahead.

This Week's Starting Point
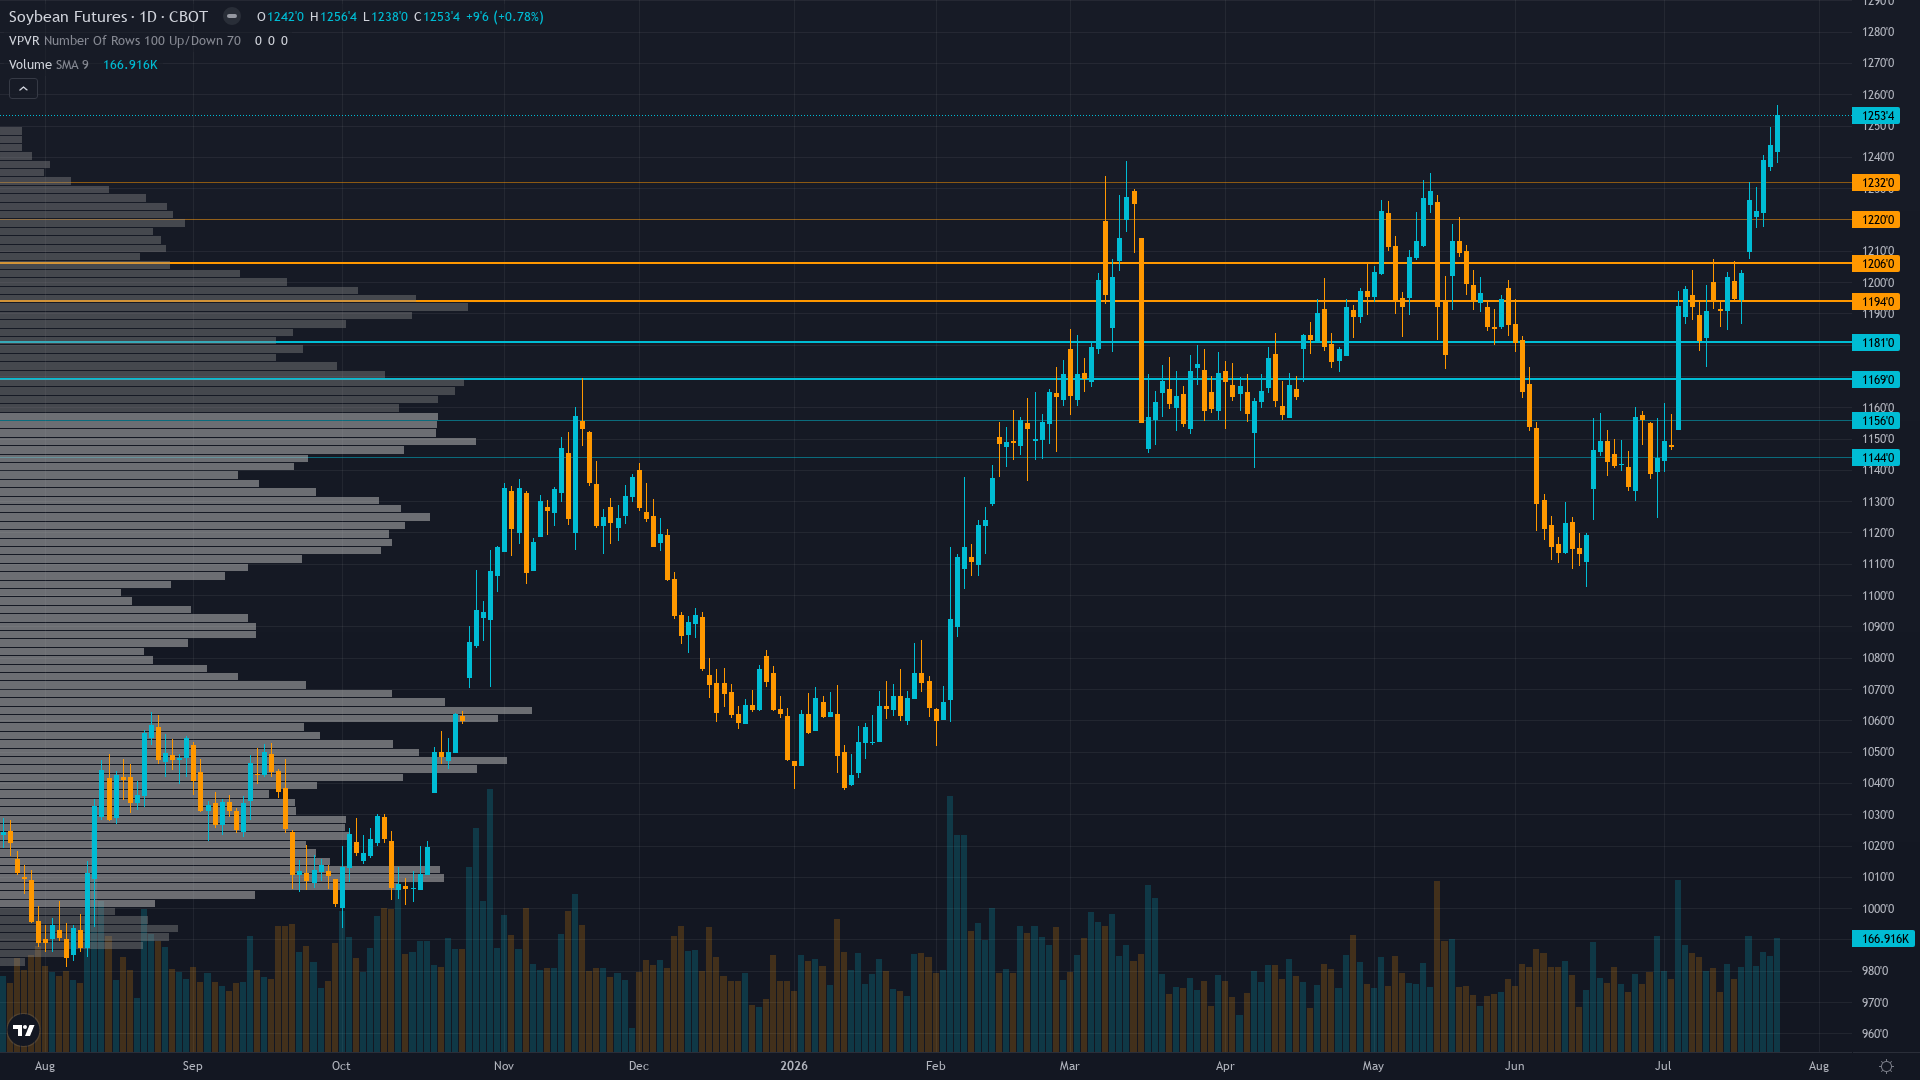
soybeans is trading at 1252.5, up a modest 0.51% as the market edges higher. soybean futures is in a breaking out to fresh 2-year highs market state, requiring careful assessment of current conditions.
Mixed with technical bulls citing breakout momentum and war premium offset by fundamental analysts concerned about positioning exhaustion after 25% year-over-year gain and sentiment bears noting profit-taking risk at 2-year highs creating range expectations between 1,220-1,260 pending August WASDE resolution
Forces in Play
Primary driver: Three consecutive MISSED calls (July 24 +5.99%, July 17 +1.76%, July 10 +4.36%) triggers mandatory Miss Reset After threshold of 3, forcing NEUTRAL for minimum 1 week per Rule 5 despite fresh breakout to 1,256.38 two-year high driven by war premium and weather concerns as AgWeb reports market supported by war, weather and China demand per Bryan Doherty July 23
Secondary factor: Post-input development identified: AgWeb July 23 reports soybeans hit contract highs with grain markets exploding to fresh highs on war and weather premium (occurring 3 days ago), while Trading Economics confirms July 23 soybean futures jumped to $12.4/bushel highest since May 2024 on escalating Middle East tensions driving oil price surge creating risk premium spillover to agricultural commodities
Additional influence: Technical breakout confirmed with July 26 fresh 52-week high at 1,256.38 cents (up 25% year-over-year) on volume of 166,916 contracts creating strong uptrend structure, yet Eight consecutive weeks of NO CALL bias now exceeds 5-week Bias Review After threshold requiring re-justification from first principles as market structure fundamentally shifts from consolidation to breakout mode
Economic backdrop: TRANSITIONAL macro regime with VIX at 16.64 below 20 risk-on threshold indicating calm volatility conditions, but DXY strength at 101.47 creating export competitiveness headwinds offset by geopolitical risk premium from Middle East tensions supporting commodity complex including agricultural assets
Fundamental assessment: Modestly undervalued at $12.53/bushel with July 10 WASDE showing global stocks-to-use declining from 29% to 25% (lowest since 2022/23), record renewable diesel demand at 2.75B bushels absorbing 62% of crop plus fresh China demand per Brownfield July 16-23 reports validating trade normalization
Technical Landscape
Confirmed breakout at 1,252.50 trading at fresh 2-year high of 1,256.38 on July 26 with volume confirmation at 166,916 contracts, Strong Buy technical ratings intact, momentum accelerating after clearing prior 1,230 May resistance creating bullish structure
Trend strength is elevated at 8/10, indicating strong directional conviction in current price action.
Risk-Reward Assessment
Primary risk: War premium dissipation if Middle East tensions de-escalate combined with favorable Midwest weather during critical August pod-fill window stabilizing yield prospects at or above USDA 53 bu/acre projection, forcing downward revision to current risk premium and triggering profit-taking from 2-year high positioning toward 1,220-1,240 support representing 3-5% downside (Probability: medium)
Primary opportunity: Sustained geopolitical risk premium plus any Midwest weather deterioration during critical August reproductive phase creating yield risk or continued strong China demand above committed levels (recent Brownfield reports show China leading buyer for old and new crop as of July 16-23) triggering continuation rally toward 1,260-1,280 resistance representing 2-4% upside (Timeframe: Next 2-4 weeks through Midwest August weather developments during critical pod-fill window, ongoing geopolitical risk assessment, weekly export sales confirmation of China demand sustainability, and August 12 WASDE updating production estimates with full July-August weather impact)
This week's edge: Resetting after 3 consecutive misses — thesis under review. Market has achieved the breakout scenario anticipated by fundamental analysis (declining stocks-to-use, China demand resumption, renewable diesel floor) but timing was wrong across three consecutive weeks, requiring mandatory neutral period to reassess whether current levels represent sustainable new equilibrium or overextended war premium vulnerable to reversal
Risk Environment
With vol at the 72th percentile, soybean price is trading in an elevated regime where daily ranges can surprise even experienced traders. Volatility is stable, with realised vol holding steady across timeframes. This equilibrium can persist but eventually resolves into expansion or contraction.
Current normal-to-elevated volatility at 72nd percentile suggests 17-25 cent daily ranges versus typical 15-20 cent agricultural baseline, breakout patterns creating resistance tests at 1,256-1,260 requiring wider stops, standard placement widened to 30-35 cents for positioning versus normal 20-25 cents given geopolitical risk premium and approaching August 12 WASDE binary catalyst
Looking Forward
All eyes turn to USDA August WASDE report updating 2026/27 supply-demand balances incorporating full July weather impact on critical pollination/pod-fill stage plus finalized yield projections and first comprehensive assessment of export pace following China demand resumption in July on Wednesday 12 August, which carries enough weight to force a decisive directional move.
The week ahead for soybean futures hinges on whether the prevailing breaking out to fresh 2-year highs regime can absorb the scheduled catalysts without a regime shift.
This analysis covers one dimension. Our full weekly report combines six specialist agents into a single actionable briefing with directional bias, key levels, and risk-opportunity matrix.
Start Free — Get the Market of the WeekFree weekly report · No credit card · Upgrade anytime



