Soybeans Forecast This Week — Outlook, Drivers & Key Levels
This week's Soybeans outlook: key drivers, volatility context, risk-opportunity assessment and the week ahead.

Market Overview
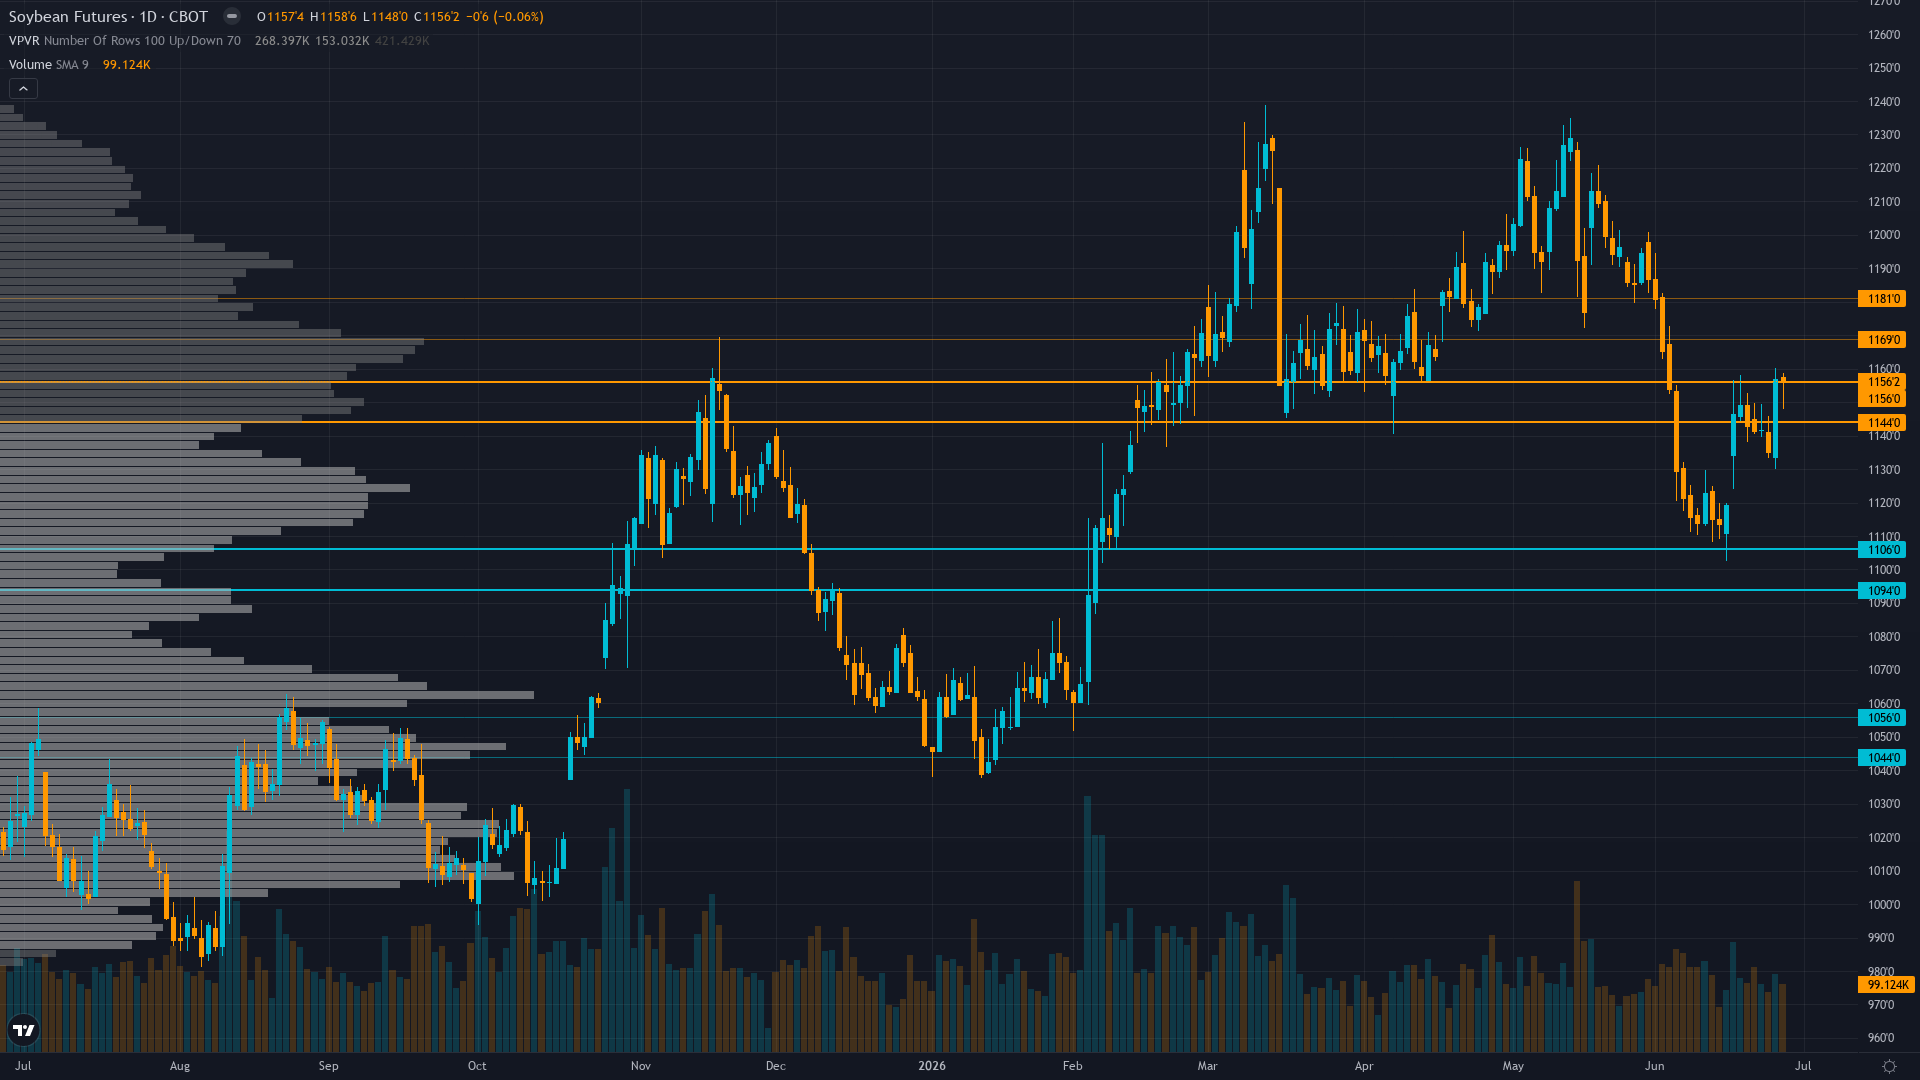
soybeans sits at 1143.88 after a 0.78% gain — a quiet move higher without aggressive momentum. soybean futures is in a consolidating after rebound from lows market state, requiring careful assessment of current conditions.
Mixed with technical bears citing breakdown momentum and positioning liquidation offset by fundamental bulls noting June WASDE declining stocks-to-use ratio and renewable diesel structural support creating range-bound consolidation expectations between 1130-1155 ahead of July 10 WASDE binary event
This Week's Catalysts & Drivers
Primary driver: Signal magnitude -0.35 falls below 1.0 minimum threshold for AGRICULTURAL directional bias per Rule 2 mandating NO CALL, as severe discipline conflicts create analytical paralysis where Fundamental (+1.5) and mild Options/Sentiment bullish lean (+0.5 each) oppose Institutional (-2.5), Technical (-1.5), and Economic (-1.5) bearish cluster in low-information-edge environment
Secondary factor: Post-input development identified: Price rallied +2.81% week ending June 26 to 1155 from prior week's 1123.38 low, representing material bounce that contradicted prior NO CALL as market recovered from February lows, though current price 1143.88 shows consolidation within 1130-1155 range as June 29 USDA Crop Progress report approaches
Additional influence: Managed money positioning shows continued liquidation with speculative longs reduced materially as of June 2 COT data, while June USDA Oil Crops Outlook confirms soybean crop rated 65% good-to-excellent (3 percentage points below year-ago) with emergence ahead of pace at 79% versus 71% five-year average, creating mixed fundamental backdrop
Economic backdrop: TRANSITIONAL macro regime with VIX at 16.41-19.44 below 20 risk-on threshold indicating calm conditions, DXY strength at 101.37 up 2.18% monthly creating export competitiveness headwinds, June 17 Fed hawkish pivot removing easing bias supporting dollar strength as new Chair Warsh signals higher-for-longer rates
Fundamental assessment: Modestly undervalued at $11.44/bushel versus USDA $11.40 season-average forecast, tight US ending stocks at 310M bushels (declining stocks-to-use ratio) plus record renewable diesel demand at 2.75B bushels providing structural floor offset by Brazilian pricing $0.80-$1.00 discount creating 8-10% export competitiveness headwind
Technical Picture
Consolidating at 1143.88 cents after bouncing from 1130 low, trading below 200-day MA at 1152 and failed breakout level at 1150, RSI oversold but showing no bullish divergence, momentum weakening after breakdown from May highs
At 4/10, trend strength is middling — enough to suggest a lean, but not enough to trade with high confidence.
Bull & Bear Case
Primary risk: Continued favorable Midwest growing conditions during critical June-July reproductive phase eliminating weather risk premium combined with sustained export sales weakness below 300K MT weekly and DXY strength above 101 forcing USDA downward revision to export projections in July 10 WASDE, triggering accelerated long liquidation toward 1100-1130 support representing 4-6% downside as renewable diesel structural floor tested (Probability: medium)
Primary opportunity: Midwest weather deterioration during critical June-July pollination window creating yield risk premium or unexpected acceleration in Chinese purchases demonstrating sustainable follow-through on 25 MMT annual commitment combined with July 10 WASDE confirming tighter-than-expected balance sheets triggering short-covering rally toward 1155-1175 resistance representing 1-3% upside (Timeframe: Next 2-3 weeks through June 29 Crop Progress report, July 10 WASDE release, and Midwest weather developments during critical reproductive phase plus resolution of current positioning liquidation dynamics)
This week's edge: Signal magnitude -0.35 falls below 1.0 minimum threshold for AGRICULTURAL directional bias per Rule 2, mandating NO CALL despite five-week streak reaching Bias Review threshold and material +2.81% contrary price action last week, as severe discipline conflicts (3v3 split where all disciplines measure 49-56% accuracy in COMMODITY class per Section 2A) plus TRANSITIONAL macro regime create insufficient conviction for directional lean where market faces genuine two-way risk requiring patience for next catalyst rather than forced directional speculation in low-information-edge environment
Volatility Regime
Volatility for soybean price is at the 64th percentile over 90 days — a normal regime that allows for standard position sizing and conventional trade management. The vol trend is flat, with no meaningful shift across timeframes. Stable vol environments often lull traders before a regime change arrives.
Current normal volatility at 64th percentile suggests 20-25 cent daily ranges versus typical 15-20 cent agricultural baseline, consolidation patterns creating support/resistance tests at 1130/1155 requiring patience for directional conviction, standard stop placement widened to 25-30 cents for positioning versus normal 20-25 cents given ongoing liquidation dynamics and approaching July 10 WASDE binary risk
What to Watch
The USDA weekly Crop Progress report at 4:00 PM EDT updating soybean crop condition ratings and development stages during critical June-July reproductive phase when weather becomes primary yield determinant, plus weekly export sales data confirming Chinese demand trajectory on Monday 29 June stands as the week's primary risk event — high-impact and capable of overriding the existing technical and sentiment setup.
The interplay between consolidating after rebound from lows market conditions and upcoming catalysts will define this week's trading landscape for CBOT soybeans.
This analysis covers one dimension. Our full weekly report combines six specialist agents into a single actionable briefing with directional bias, key levels, and risk-opportunity matrix.
Start Free — Get the Market of the WeekFree weekly report · No credit card · Upgrade anytime



