Soybeans COT & Institutional Positioning — Smart Money Analysis
Soybeans institutional positioning: COT data, sentiment analysis and smart money flow assessment.

The Institutional Landscape
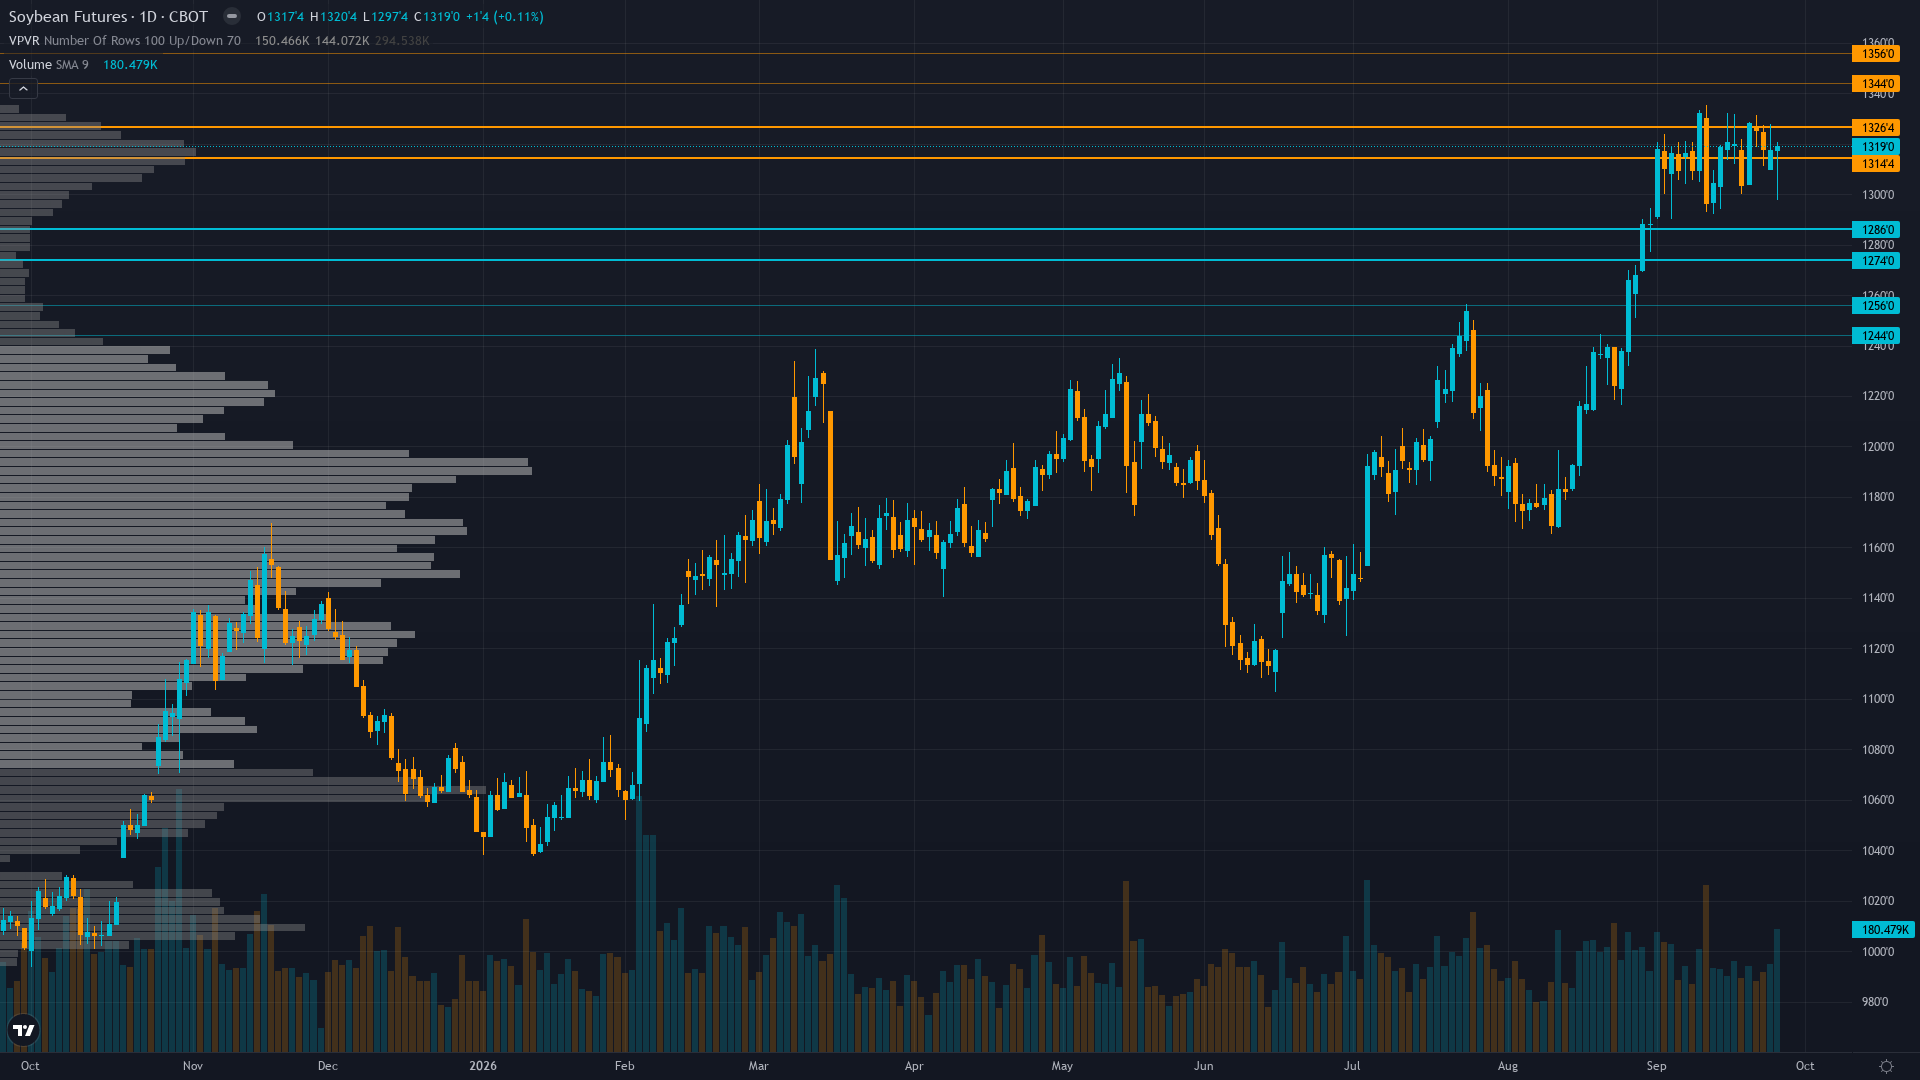
Trading at 1319 with a 0.31% uptick, soybeans is drifting higher without strong conviction.
CFTC COT September 22: non-commercial net long 281,581 contracts (25.3% of OI, 99.4th percentile of 3-year range, at the ABSOLUTE 3-year maximum) up +20,398 contracts weekly; commercial hedgers net short -257,544 contracts — this is the highest speculative net long in the available dataset, creating extreme asymmetric downside risk if harvest pressure eventually materializes
Market Consensus vs Our Analysis
Market consensus: Market sharply divided between near-term bulls citing rain-delayed harvest creating spot supply crunch, soymeal backwardation, and processor scramble for beans, versus positioning bears warning that 99.4th percentile speculative net longs (281,581 contracts) at the 3-year maximum combined with pre-Grain Stocks binary event risk and eventual harvest acceleration create asymmetric downside vulnerability
Primary driver: Record September rainfall across the western Midwest is delaying the US soybean harvest, tightening spot supplies, forcing processors to offer hefty premiums for immediate deliveries, and inverting the soymeal futures curve (October life-of-contract high, trading at premium to December for first time in over two years per Reuters Sep 24-25)
Contrarian Assessment
NO CALL bias caps MAD at 40; the desk identifies the rain-delayed harvest as a material bullish catalyst not fully captured in the pre-existing discipline inputs, and sees the market underweighting the structural risk that these speculative longs at the 3-year maximum will face forced liquidation once harvest weather improves, but the neutral directionality and low conviction limit the divergence claim to mild territory
Sentiment & Positioning
Sentiment around soybean futures is neutral, with no extreme positioning on either side. This balanced state often resolves when a catalyst breaks the equilibrium.
Options Market Signal
November soybean options show implied volatility at 19.17% slightly below 20-day realized vol of 19.9%, suggesting normal volatility pricing; put/call OI ratio of 0.75 indicates call-heavy positioning consistent with lingering bullish sentiment; pre-Grain Stocks report event premium likely building into September 30 release
Putting It Together
In summary, the positioning picture for soybeans reflects fear conviction levels set against a consolidating market backdrop. Trend strength sits at 6/10, reflecting a market that has directional bias but hasn't reached extreme conviction. The interplay between smart money activity, retail sentiment, and options market signals will shape how this positioning resolves.
This analysis covers one dimension. Our full weekly report combines six specialist agents into a single actionable briefing with directional bias, key levels, and risk-opportunity matrix.
Start Free — Get the Market of the WeekFree weekly report · No credit card · Upgrade anytime


