Soybeans COT & Institutional Positioning — Smart Money Analysis
Soybeans institutional positioning: COT data, sentiment analysis and smart money flow assessment.

Institutional Positioning
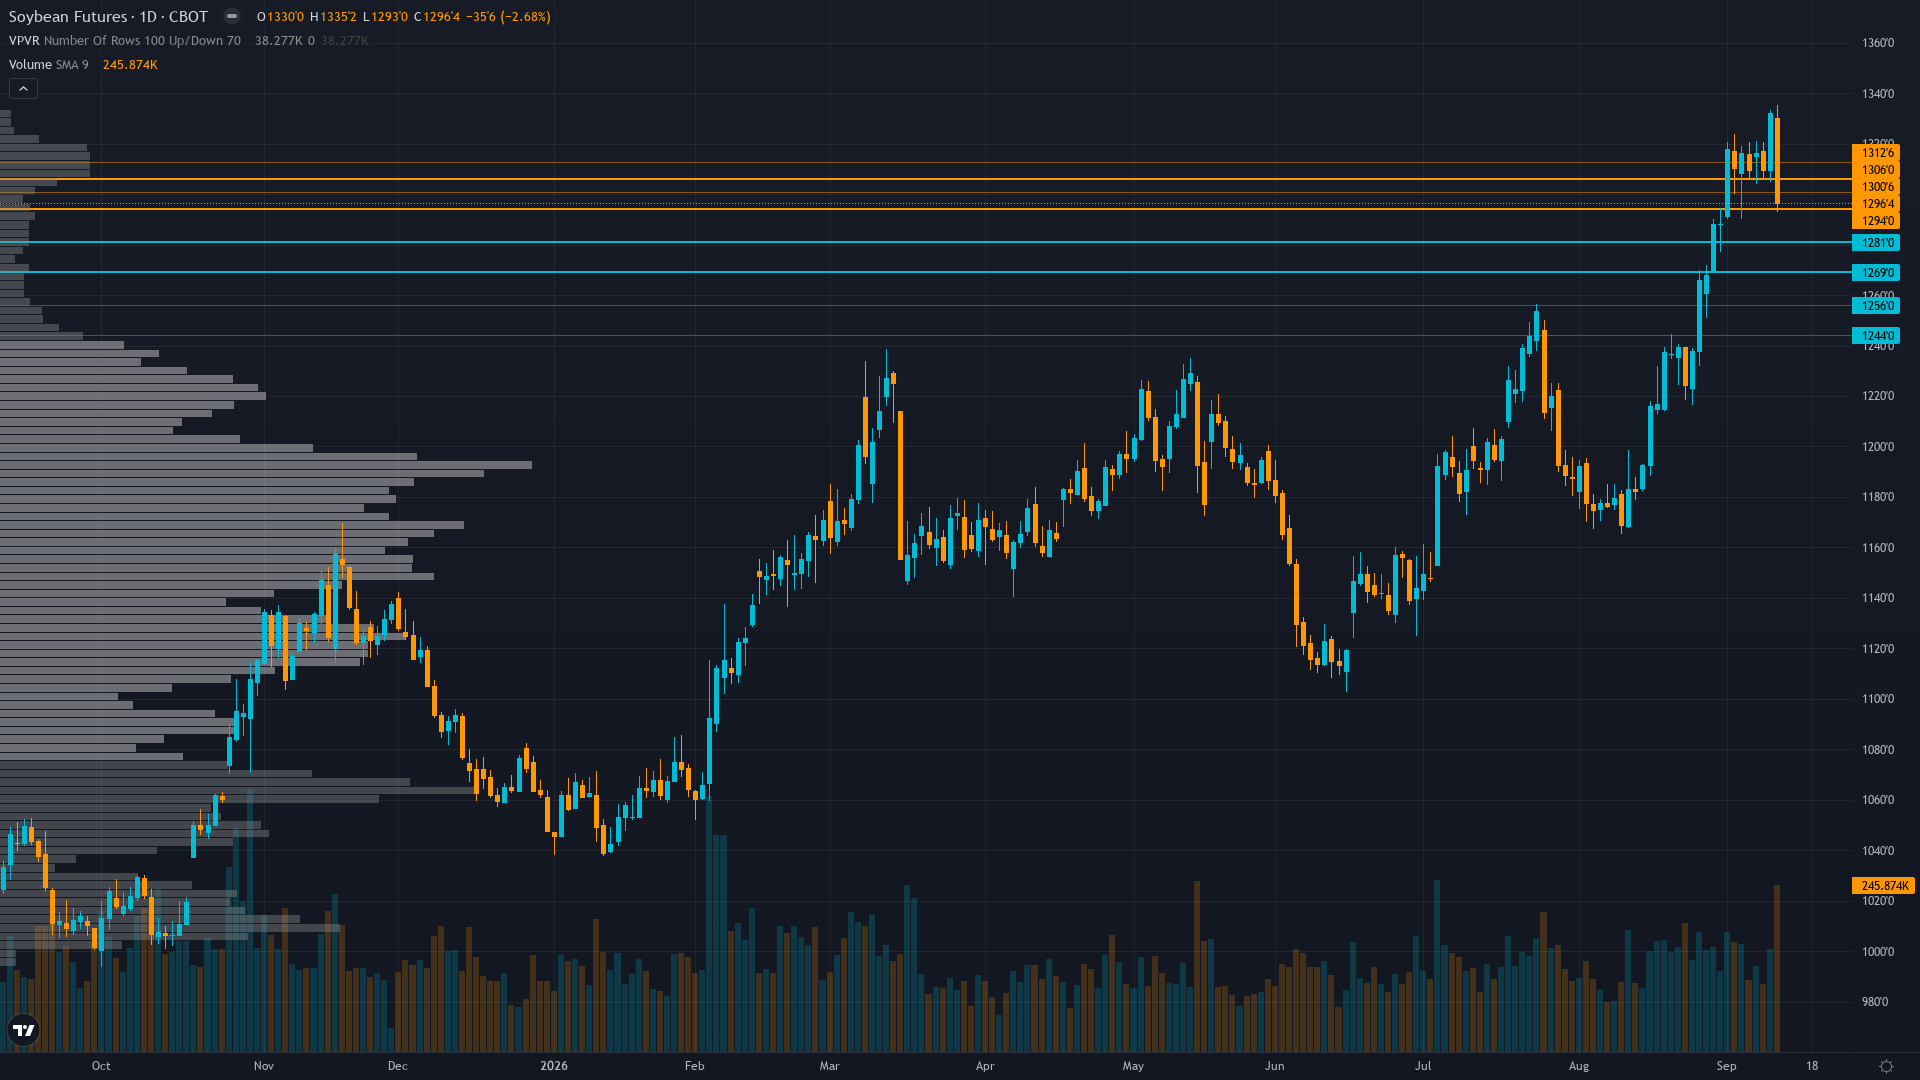
soybeans is trading at 1280.25, down 0.41% in a measured pullback.
CFTC COT September 8: non-commercial net long 273,424 contracts (25.5% of OI, 99.4th percentile of 3-year range, at 3-year MAXIMUM) — up 25,437 contracts weekly; commercial hedgers net short -251,550 contracts; extreme speculative length at all-time high creates acute asymmetry toward forced liquidation as harvest and WASDE bearish surprise create catalysts for unwind
Where We Agree & Diverge
Market consensus: Post-WASDE bearish lean as market digests supply-side disappointment: yield increased above expectations breaking the tight-supply narrative that drove August rally, with extreme speculative positioning at 99.4th percentile creating acute liquidation vulnerability, though crop conditions at 58% G/E and China demand provide competing support that prevents outright panic selling
Primary driver: September 11 WASDE delivered a bearish supply-side surprise — soybean yield raised to 52.8 bpa (above 52.4 trade estimate and 52.7 August), production at 4.535B bushels (above 4.501B expected), and ending stocks at 310M (above 290-298M consensus), breaking the prior bullish narrative of tightening supply and triggering a -1.52% selloff on report day
Consensus Gaps
The desk's BEARISH bias diverges from residual bullish market sentiment still reflected in call-dominant options positioning and the August rally mentality, but the divergence is moderated because the WASDE bearish surprise is only 2 days old and consensus is actively repricing; the extreme 99.4th percentile institutional positioning contradicted by WASDE represents a genuine blindspot the market has not yet fully priced as forced liquidation risk
Sentiment Analysis
Positioning in soybean futures is balanced, with neither bulls nor bears holding a decisive edge. Neutral sentiment typically precedes a directional catalyst.
Derivatives Intelligence
Limited agricultural options data; IV at 19.17% below 20d realized vol of 19.8% suggesting IV slightly undervaluing near-term volatility; put/call OI ratio 0.75 with call wall at $250 and put wall at $120 — call dominance reflects lingering bullish sentiment despite WASDE disappointment
Net Assessment
The institutional landscape for soybean price shows greed sentiment. Trend strength sits at 5/10, reflecting moderate directional pressure without clear dominance. The combination of positioning data, sentiment, and options flow provides context for understanding where smart money is leaning heading into the week.
This analysis covers one dimension. Our full weekly report combines six specialist agents into a single actionable briefing with directional bias, key levels, and risk-opportunity matrix.
Start Free — Get the Market of the WeekFree weekly report · No credit card · Upgrade anytime


