Soybeans COT & Institutional Positioning — Smart Money Analysis
Soybeans institutional positioning: COT data, sentiment analysis and smart money flow assessment.

Institutional Positioning
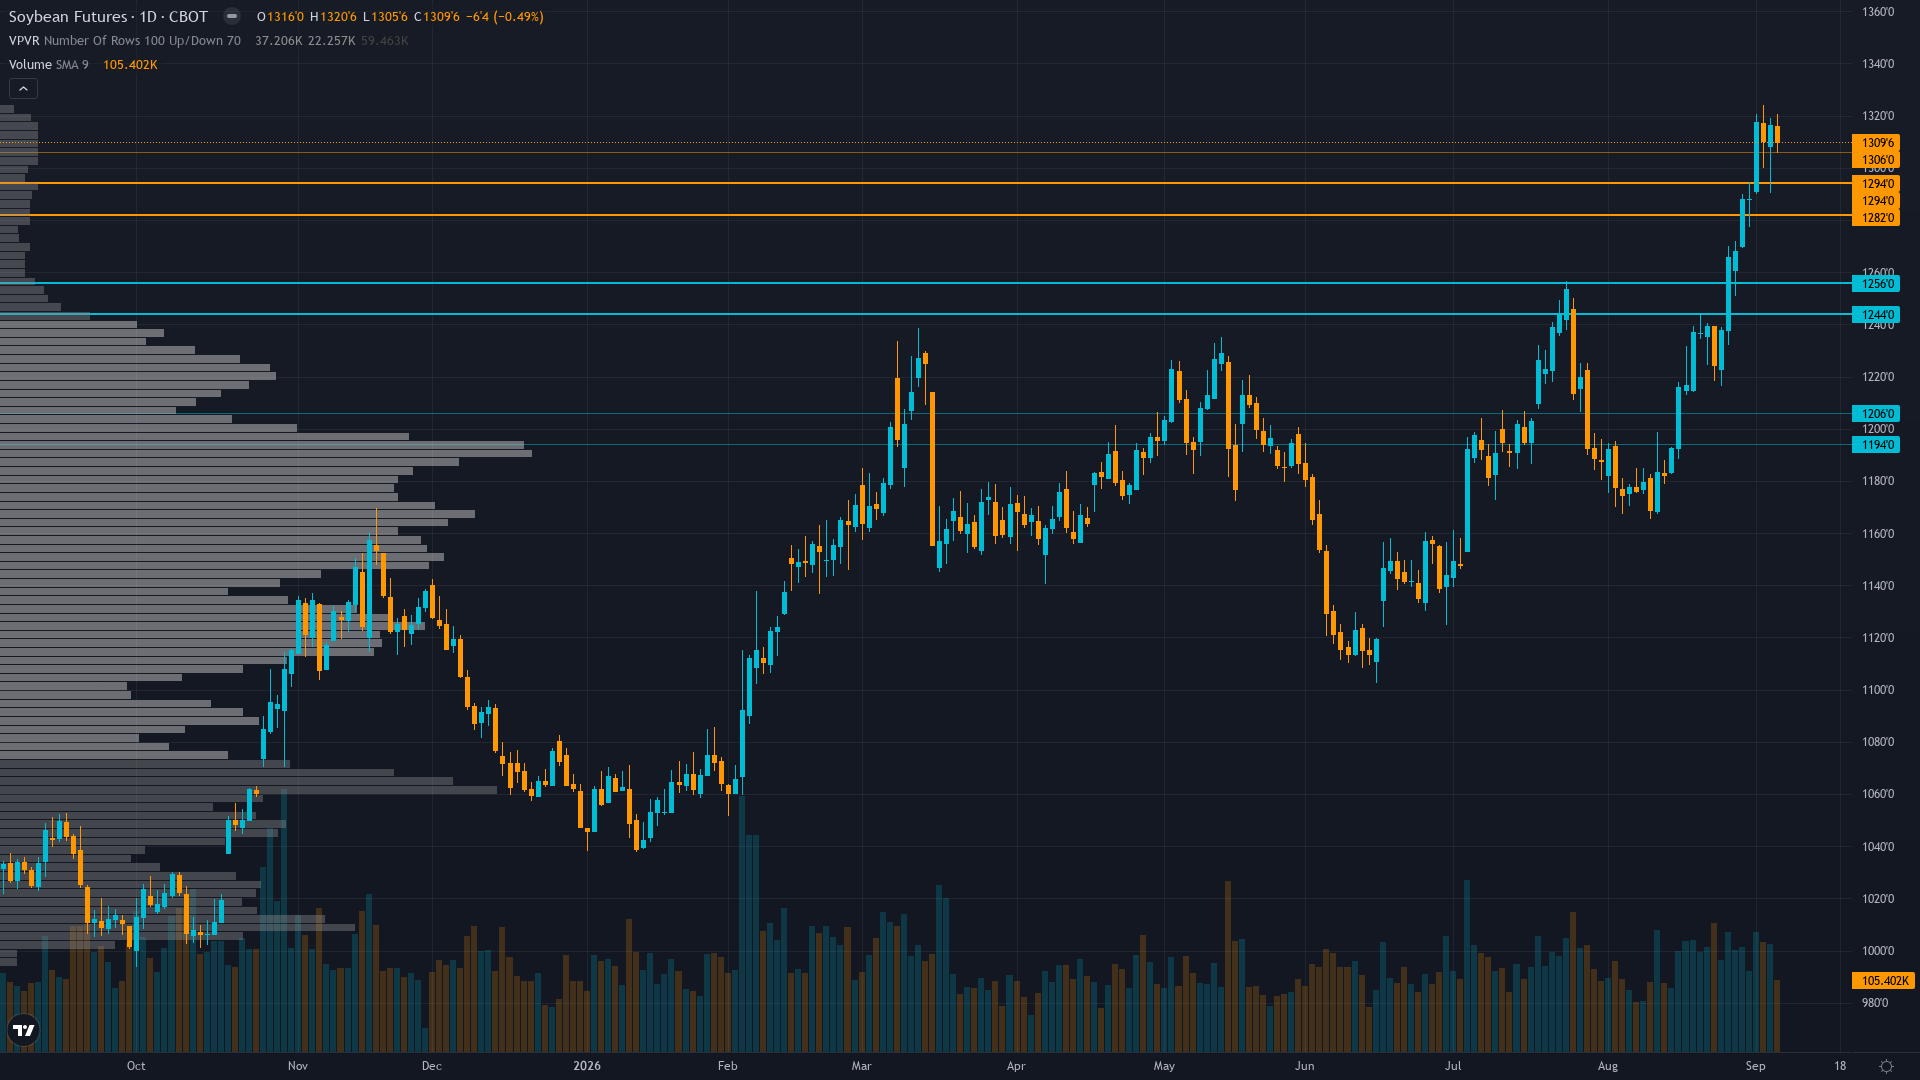
Trading at 1293.75 with a 0.92% dip, soybeans is giving back ground gradually.
CFTC COT September 1 shows non-commercial net long at 247,987 contracts (24.1% of OI, 98.7th percentile of 3-year range) — near-record speculative length up 26,560 contracts weekly; commercial hedgers net short -228,742 contracts creating classic divergence with extreme liquidation risk
Where We Agree & Diverge
Market consensus: Mixed with bullish fundamental tone tempered by extreme positioning risk: market recognizes tight supply-demand and robust Chinese demand but 98.7th percentile speculative net long creates acute vulnerability ahead of September 11 WASDE yield resolution that could trigger sharp two-way volatility
Primary driver: Extreme speculative long positioning at 98.7th percentile (247,987 contracts net long) creates acute contrarian vulnerability ahead of September 11 WASDE binary event, completely offsetting otherwise bullish fundamental and technical convergence
Consensus Gaps
Low divergence as desk issues NO CALL bias with signal near zero, reflecting balanced two-way risk rather than contrarian positioning; while the extreme 98.7th percentile institutional positioning is a genuine vulnerability, the market broadly acknowledges both the bullish fundamental case and the positioning risk, so the desk's inability to determine directional advantage does not represent a meaningful divergence from the mixed consensus view
Sentiment Analysis
Positioning in soybean futures is balanced, with neither bulls nor bears holding a decisive edge. Neutral sentiment typically precedes a directional catalyst.
Derivatives Intelligence
Limited data; soybean options at ~19.17% IV for November contracts, put/call ratio 0.89 by volume and OI indicating mild call bias; no unusual activity detected; thin agricultural options markets limit signal value
Net Assessment
The institutional landscape for soybean price shows greed sentiment. Trend strength registers at 6/10, suggesting meaningful but not extreme directional bias. The combination of positioning data, sentiment, and options flow provides context for understanding where smart money is leaning heading into the week.
This analysis covers one dimension. Our full weekly report combines six specialist agents into a single actionable briefing with directional bias, key levels, and risk-opportunity matrix.
Start Free — Get the Market of the WeekFree weekly report · No credit card · Upgrade anytime



