Soybeans COT & Institutional Positioning — Smart Money Analysis
Soybeans institutional positioning: COT data, sentiment analysis and smart money flow assessment.

Institutional Positioning
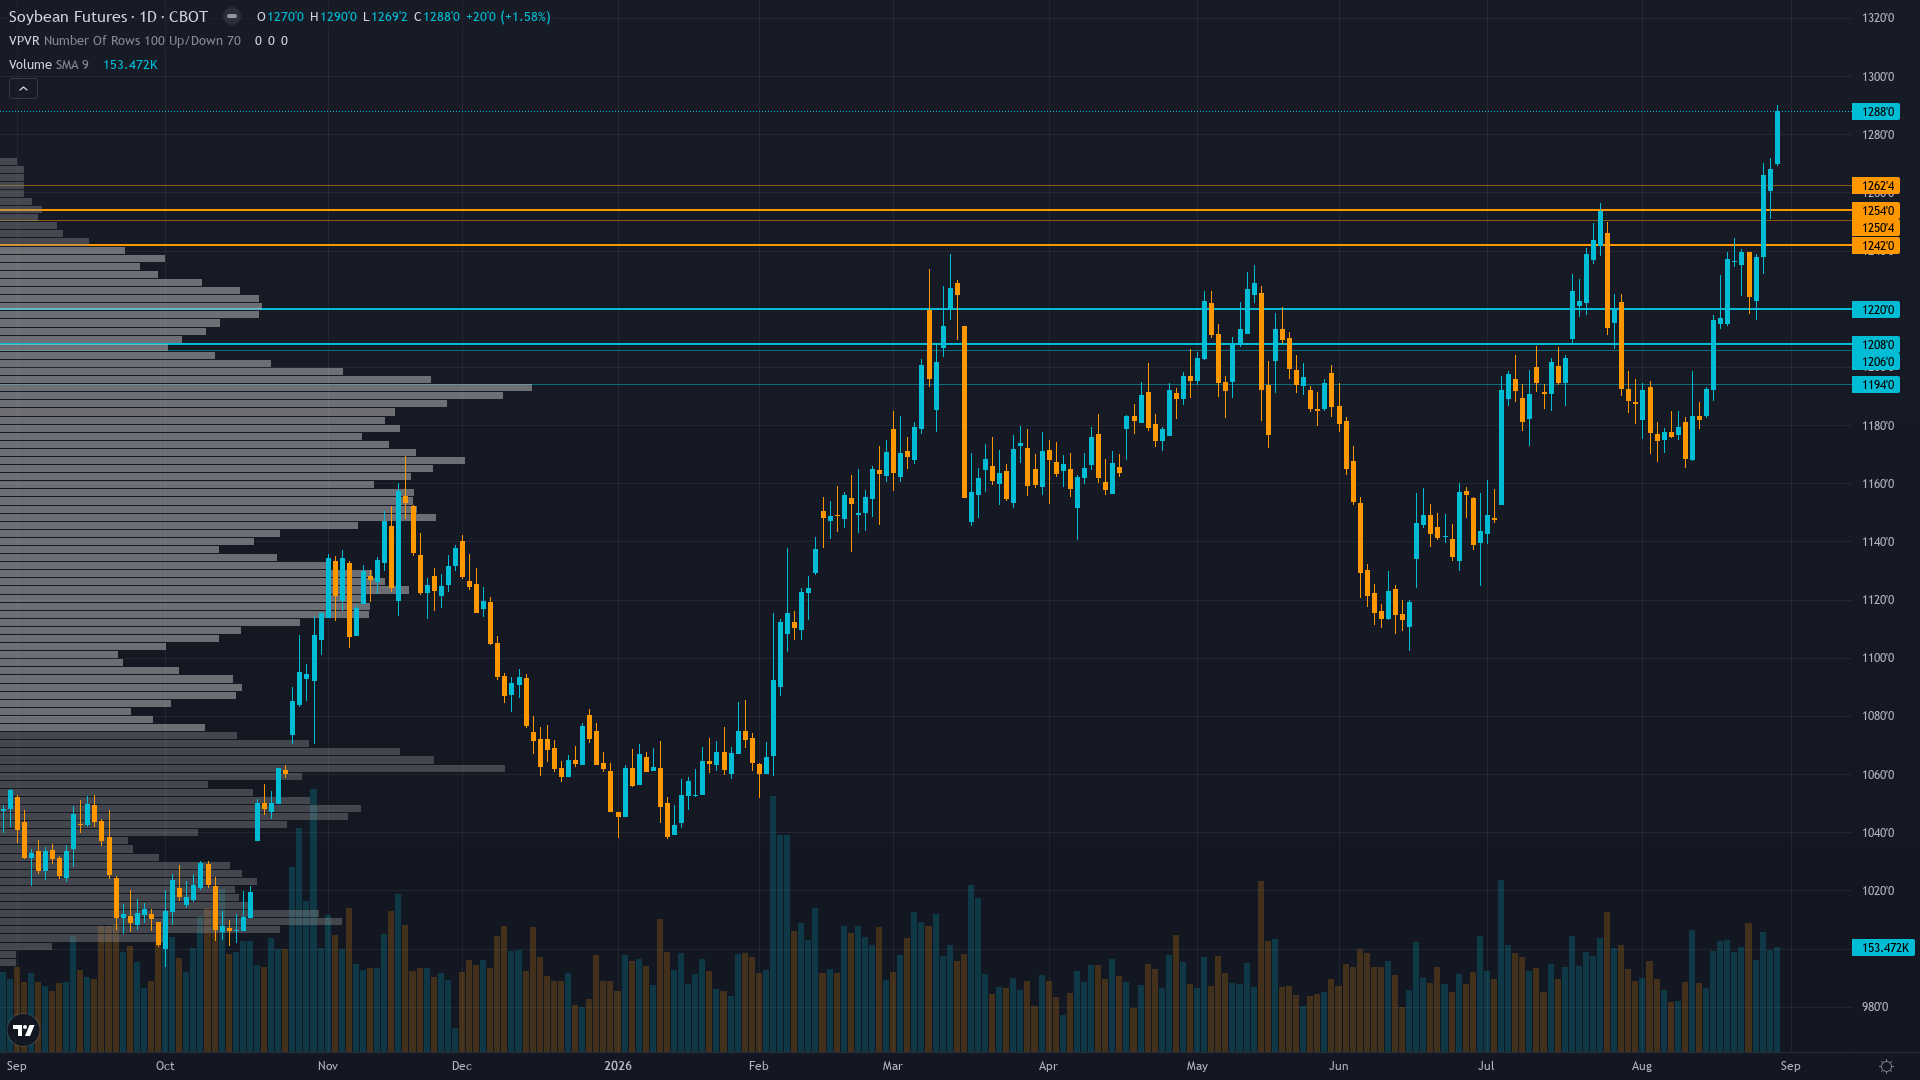
soybeans is trading at 1276.25, essentially flat as the market digests recent moves.
Non-commercial net long 221,427 contracts as of Aug 25 (93.7th percentile of 3-year range), up 30,466 contracts weekly, representing extreme speculative length at near-record levels; commercial hedgers net short -199,936 contracts indicating aggressive producer hedging into harvest; positioning creates elevated vulnerability to sharp liquidation if September WASDE disappoints
Where We Agree & Diverge
Market consensus: Bullish with positioning risk: market consensus acknowledges powerful demand-side catalyst from Chinese buying and tightening supply from declining crop conditions, but extreme speculative net long at 93.7th percentile creates vulnerability ahead of September 11 WASDE binary event where Pro Farmer's 53.3 BPA yield estimate versus USDA's 52.7 BPA will be resolved
Primary driver: Explosive Chinese demand driving record export sales: USDA confirmed new-crop soybean sales topped 90 million bushels for week ending August 20, with China accounting for ~40.5 million bushels and over 80% of total new-crop sales, validating trade normalization under the 25 MMT annual commitment framework and creating a powerful demand-side catalyst that has overwhelmed seasonal harvest pressure expectations
Consensus Gaps
Mild divergence: the desk's BULLISH bias aligns with market consensus directionality but the emphasis on the asymmetric downside risk from extreme 93.7th percentile speculative positioning ahead of a potential bearish September WASDE yield surprise (Pro Farmer 53.3 vs USDA 52.7 BPA) identifies a specific vulnerability the bullish market is not adequately pricing, though the desk's own BULLISH bias limits the contrarian claim to mild divergence territory
Sentiment Analysis
Positioning in soybean futures is balanced, with neither bulls nor bears holding a decisive edge. Neutral sentiment typically precedes a directional catalyst.
Derivatives Intelligence
Limited data for agricultural options markets; implied volatility not reliably available but post-breakout IV likely expanding from depressed levels as event risk premium builds ahead of September 11 WASDE; insufficient data for directional signal from options market
Net Assessment
The institutional landscape for soybean price shows greed sentiment. Trend strength is elevated at 8/10, indicating strong directional conviction in current price action. The combination of positioning data, sentiment, and options flow provides context for understanding where smart money is leaning heading into the week.
This analysis covers one dimension. Our full weekly report combines six specialist agents into a single actionable briefing with directional bias, key levels, and risk-opportunity matrix.
Start Free — Get the Market of the WeekFree weekly report · No credit card · Upgrade anytime



