Soybeans COT & Institutional Positioning — Smart Money Analysis
Soybeans institutional positioning: COT data, sentiment analysis and smart money flow assessment.

Institutional Positioning
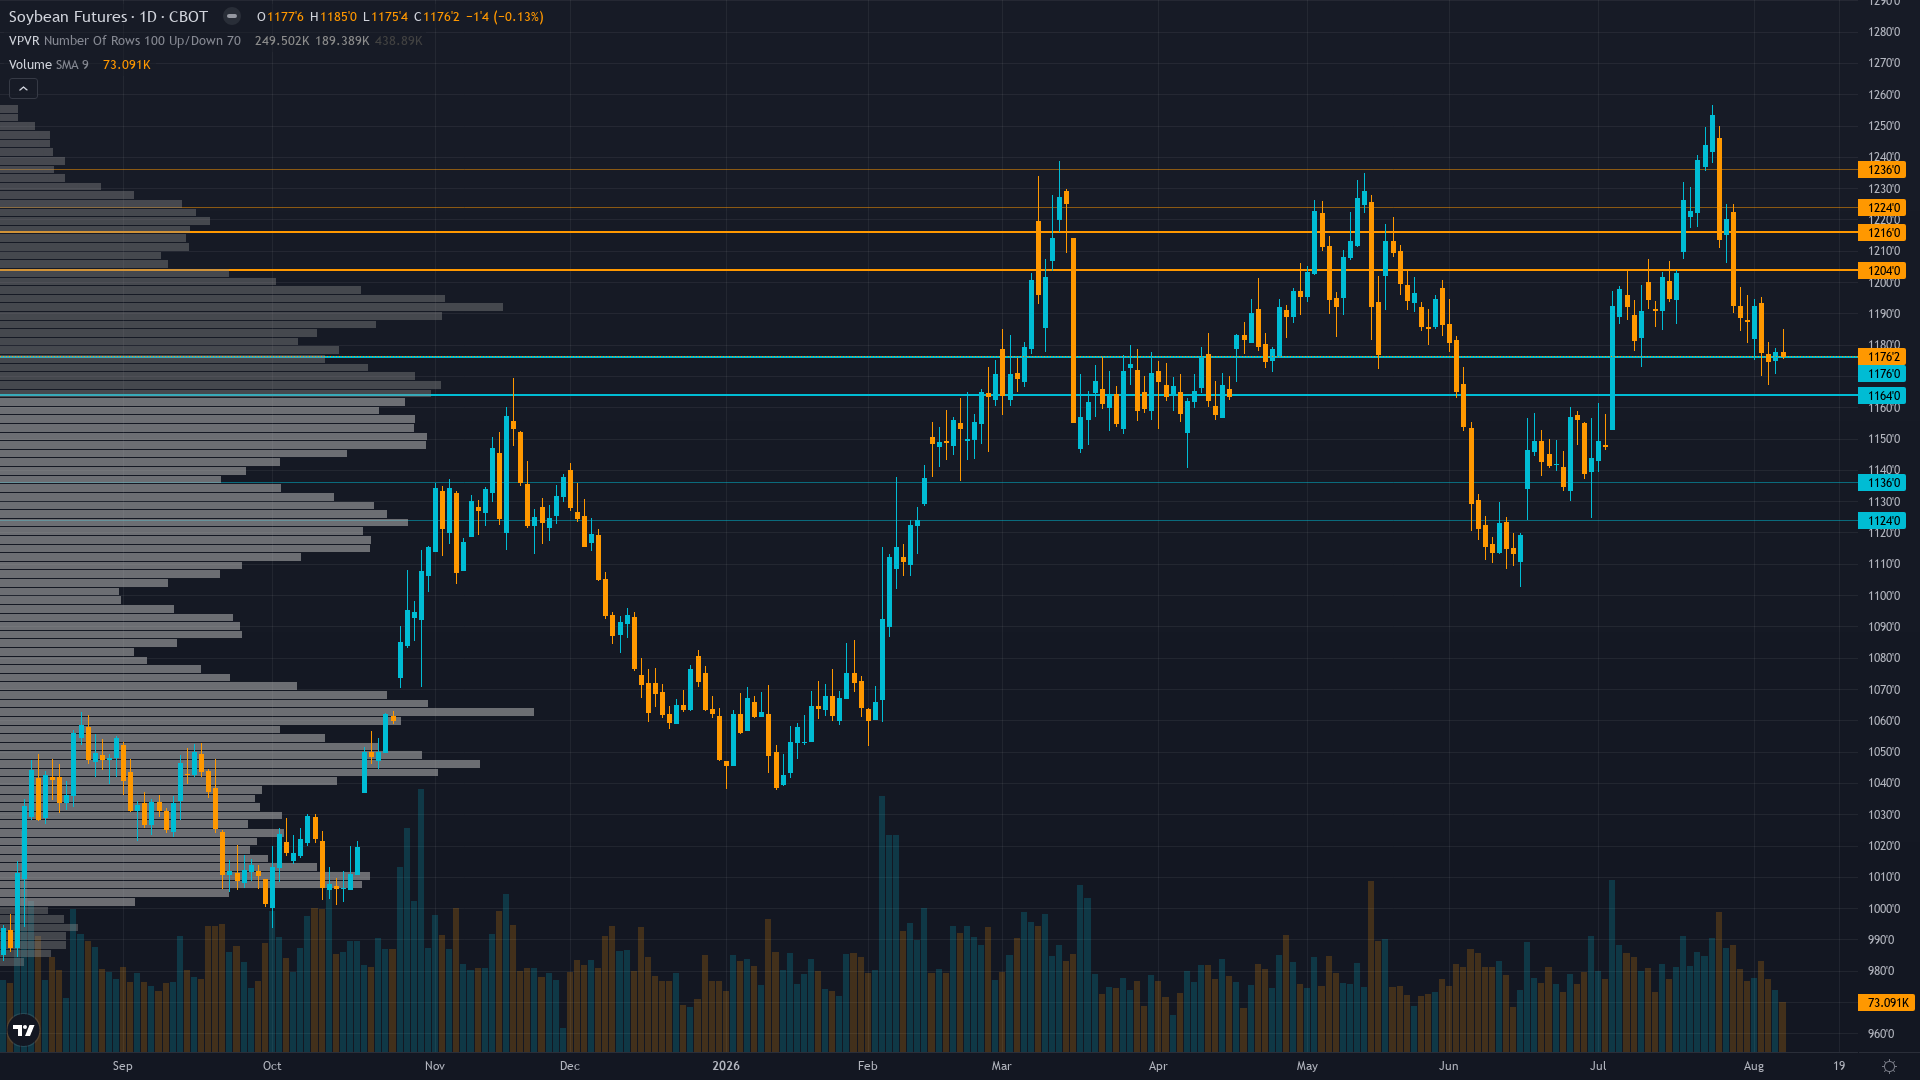
Trading at 1156.5 with a 0.24% dip, soybeans is giving back ground gradually.
Non-commercial net long 175,542 contracts as of Aug 4, down 36,215 contracts weekly, still at elevated 83.5th percentile of 3-year range; commercial hedgers net short -156,752 contracts; aggressive speculative liquidation combined with elevated percentile suggests further long unwinding potential with WASDE as catalyst
Where We Agree & Diverge
Market consensus: Mixed with bearish bias: ample global supply expectation from StoneX 4.47 bbu production estimate and favorable Midwest rain forecast during pod-fill offset by steady 63% G/E crop conditions below analyst expectations, managed money liquidation from elevated 83.5th percentile positioning, and August 12 WASDE binary event creating range-bound consolidation between 1140-1180 with downside bias toward 1100 support if comfortable supply confirmed
Primary driver: Mandatory Miss Reset triggered: 6 consecutive MISSED calls (Aug 7 -1.79%, Jul 31 -5.13%, Jul 24 +5.99%, Jul 17 +1.76%, Jul 10 +4.36%) far exceeds ZS Miss Reset After threshold of 3, forcing NEUTRAL per Rule 5 for minimum 1 week, compounded by August 12 WASDE binary event 3 days away triggering mandatory -2 conviction penalty per AGRICULTURAL Rule 6
Consensus Gaps
NEUTRAL bias and mandatory miss reset prevent meaningful divergence claim; the desk's assessment that the market faces genuine two-way risk through WASDE largely aligns with consensus uncertainty rather than opposing a clear directional view, and 6 consecutive misses eliminate any credibility for contrarian positioning
Sentiment Analysis
Positioning in soybean futures is balanced, with neither bulls nor bears holding a decisive edge. Neutral sentiment typically precedes a directional catalyst.
Derivatives Intelligence
Limited data for agricultural options; put/call ratio at 0.89 indicating slight call bias on stale data; pre-WASDE event premium building with IV likely expanding toward 75-80th percentile 3-5 days before release
Net Assessment
The institutional landscape for soybean price shows neutral sentiment. Trend strength is low at 3/10, indicating weak directional conviction and potential for range-bound behaviour. The combination of positioning data, sentiment, and options flow provides context for understanding where smart money is leaning heading into the week.
This analysis covers one dimension. Our full weekly report combines six specialist agents into a single actionable briefing with directional bias, key levels, and risk-opportunity matrix.
Start Free — Get the Market of the WeekFree weekly report · No credit card · Upgrade anytime



