Soybeans COT & Institutional Positioning — Smart Money Analysis
Soybeans institutional positioning: COT data, sentiment analysis and smart money flow assessment.

Institutional Positioning
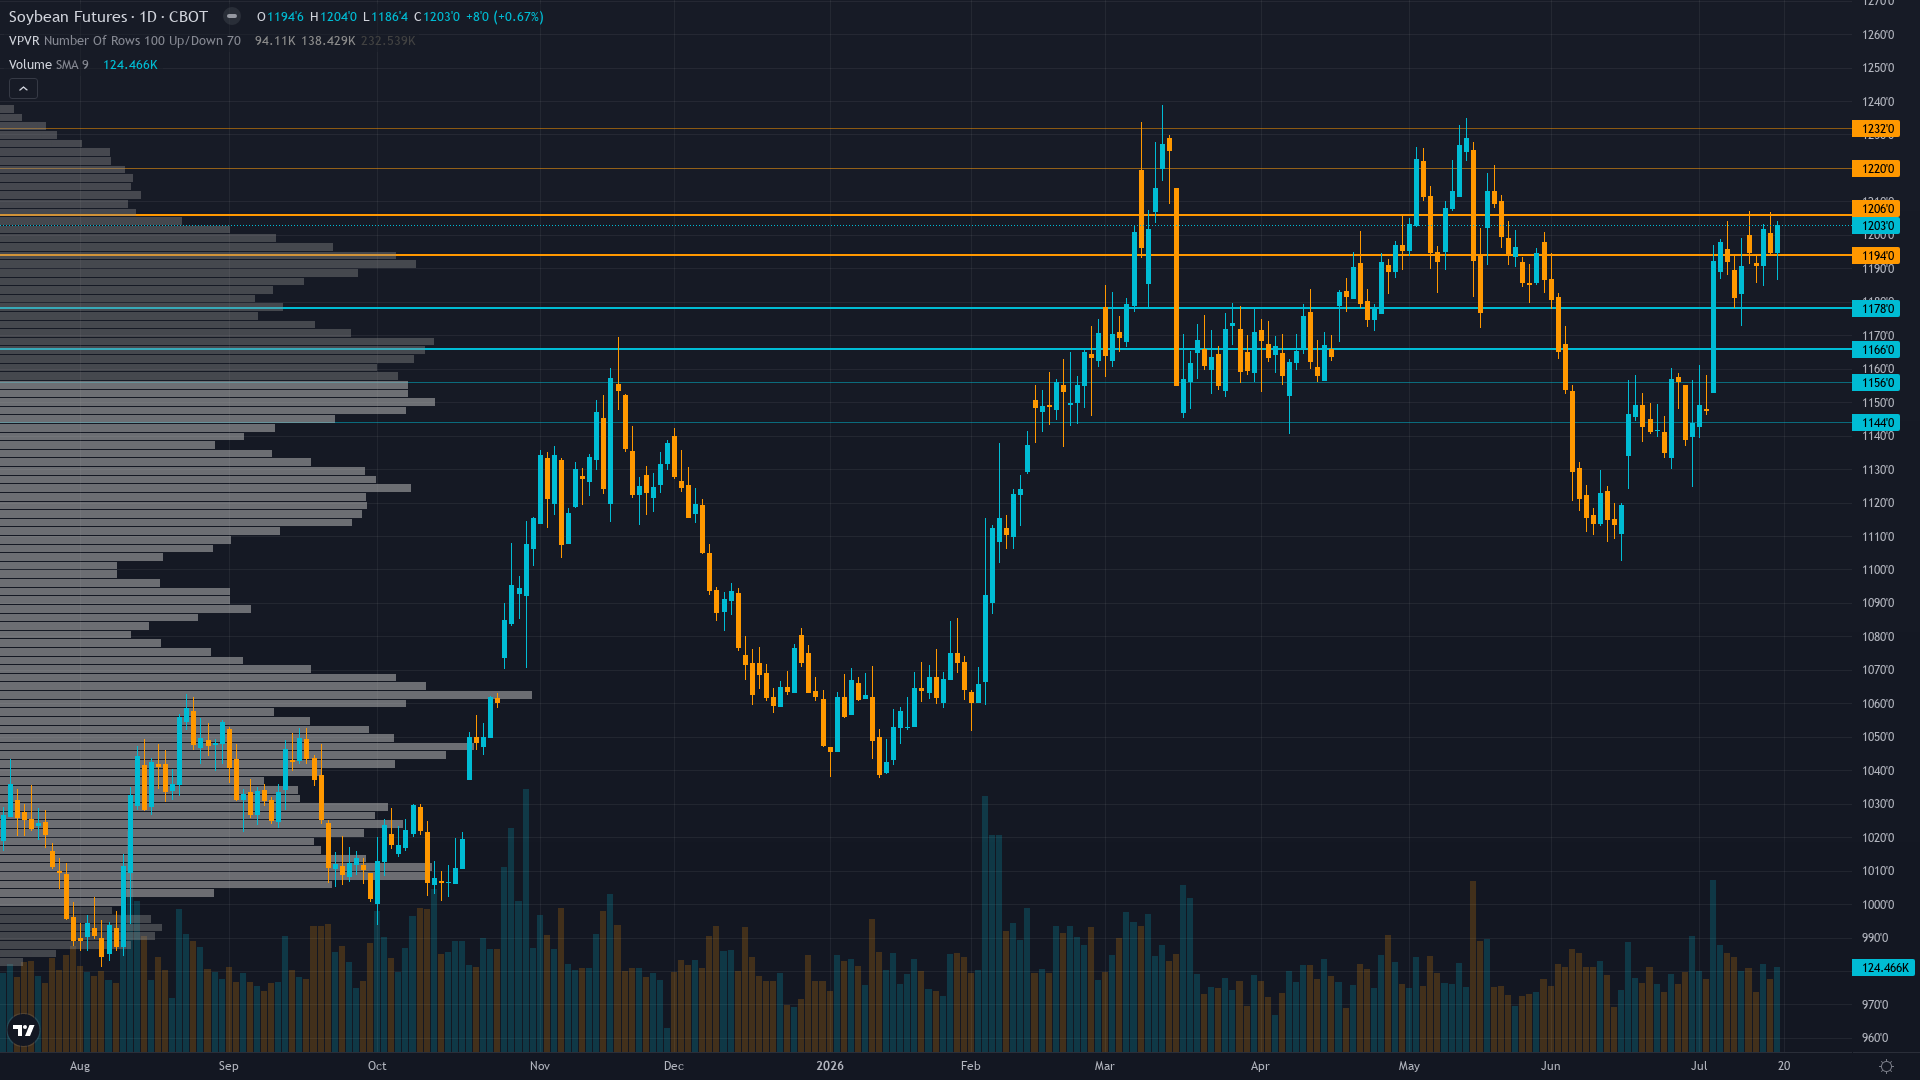
soybeans sits at 1181.75 after slipping 0.77% — a shallow pullback rather than a decisive move.
Managed money positioning at mid-range following May-June liquidation from positioning extremes, with recent week data unavailable but prior COT showing net long reduction creating uncertainty about current speculative commitment ahead of August 12 WASDE
Where We Agree & Diverge
Market consensus: Mixed with fundamental bulls citing July 10 WASDE tightening stocks-to-use ratio and China demand resumption offset by technical analysts noting consolidation fatigue and export analysts highlighting Brazilian pricing advantages creating range-bound expectations between 1175-1200 ahead of August 12 WASDE
Primary driver: SEVEN consecutive NO CALL weeks (exceeding 5-week Bias Review threshold) mandates re-justification from first principles as market consolidates at 1181.75 cents in critical low-information-edge environment where signal magnitude +0.85 falls below 1.0 minimum threshold for AGRICULTURAL directional bias despite China resuming US soybean purchases with 330,000 tons bought July 6 and July 13 crop conditions at 65% good-to-excellent creating discipline conflicts
Consensus Gaps
NO CALL bias limits divergence potential to low range despite desk identifying renewable diesel structural demand floor at 2.75B bushels plus China demand resumption July 6-16 as creating potential support, as signal below minimum threshold prevents meaningful contrarian statement and analysis largely confirms mixed market consensus of two-way risk rather than opposing clear directional view, with insufficient conviction differential to claim meaningful edge over crowd positioning despite fresh demand catalyst
Sentiment Analysis
Positioning in soybean futures is balanced, with neither bulls nor bears holding a decisive edge. Neutral sentiment typically precedes a directional catalyst.
Derivatives Intelligence
Insufficient current data for ZS agricultural options with thin liquidity characteristic of agricultural futures options preventing meaningful directional assessment, reducing signal contribution to near-zero
Net Assessment
The institutional landscape for soybean price shows neutral sentiment. Trend strength sits at 5/10, reflecting moderate directional pressure without clear dominance. The combination of positioning data, sentiment, and options flow provides context for understanding where smart money is leaning heading into the week.
This analysis covers one dimension. Our full weekly report combines six specialist agents into a single actionable briefing with directional bias, key levels, and risk-opportunity matrix.
Start Free — Get the Market of the WeekFree weekly report · No credit card · Upgrade anytime



