Soybeans COT & Institutional Positioning — Smart Money Analysis
Soybeans institutional positioning: COT data, sentiment analysis and smart money flow assessment.

Smart Money Positioning
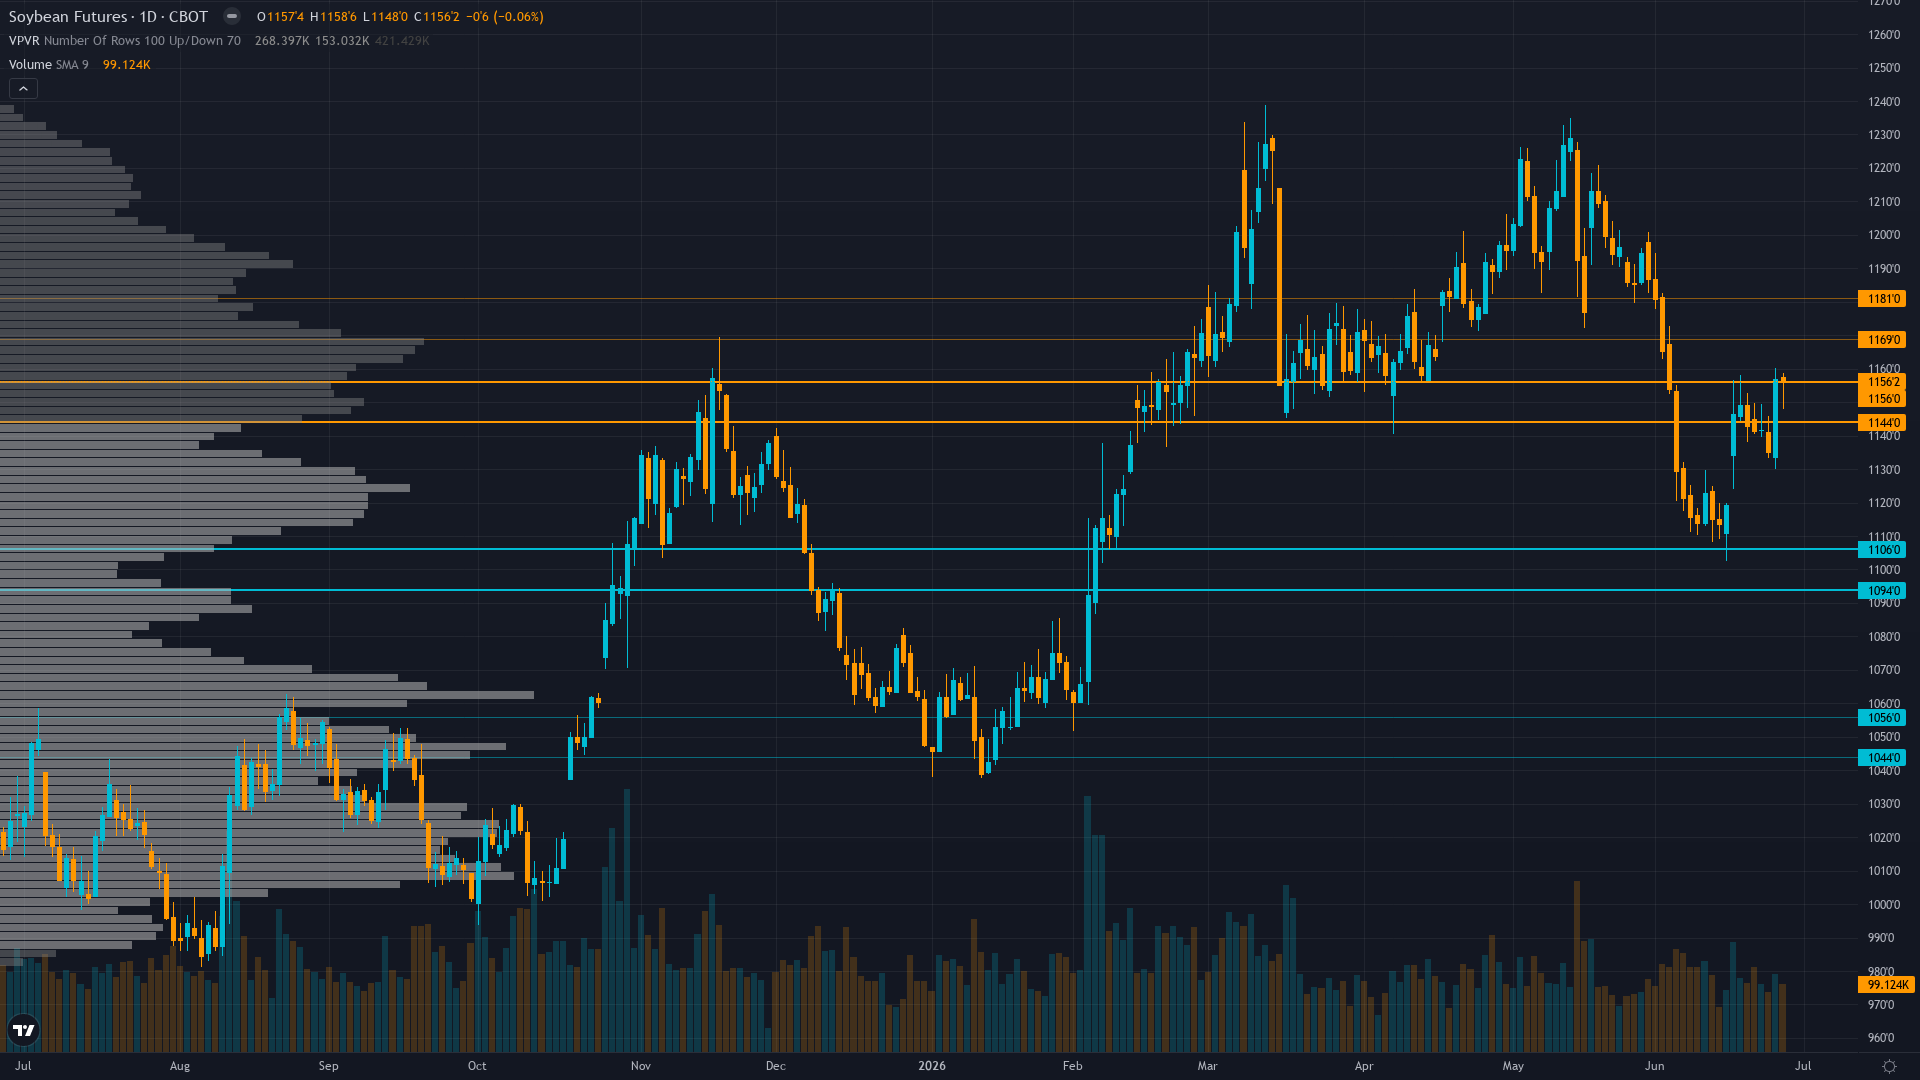
soybeans is trading at 1143.88, up a modest 0.78% as the market edges higher.
Speculative long liquidation accelerated with managed money cutting positions materially in week ending June 2 as COT data shows paper speculation versus commercial accumulation divergence, confirming institutional bearish momentum though positioning at mid-range historically suggests unwind may be incomplete
Consensus Check
Market consensus: Mixed with technical bears citing breakdown momentum and positioning liquidation offset by fundamental bulls noting June WASDE declining stocks-to-use ratio and renewable diesel structural support creating range-bound consolidation expectations between 1130-1155 ahead of July 10 WASDE binary event
Primary driver: Signal magnitude -0.35 falls below 1.0 minimum threshold for AGRICULTURAL directional bias per Rule 2 mandating NO CALL, as severe discipline conflicts create analytical paralysis where Fundamental (+1.5) and mild Options/Sentiment bullish lean (+0.5 each) oppose Institutional (-2.5), Technical (-1.5), and Economic (-1.5) bearish cluster in low-information-edge environment
Divergence Assessment
NO CALL bias limits divergence potential to low range despite desk identifying renewable diesel structural demand floor at 2.75B bushels as underpriced support mechanism, as signal below minimum threshold prevents meaningful contrarian statement and analysis largely confirms mixed market consensus of two-way risk ahead of July 10 WASDE rather than opposing clear directional view, with insufficient conviction differential to claim meaningful edge over crowd positioning
Market Sentiment
The sentiment picture for soybean futures is evenly split, providing no contrarian signal in either direction. The next move will likely be event-driven.
What Options Markets Show
July 2026 implied volatility at 12.68% reflects subdued pricing with no significant event premium despite approaching USDA report, thin agricultural options liquidity limits directional signal but low IV suggests complacency rather than defensive positioning
Positioning Summary
Putting the positioning picture together for CBOT soybeans: sentiment is neutral, trend strength at 4/10 paints a picture of a market with some direction but lacking strong conviction. The net assessment from institutional data, crowd positioning, and derivatives activity points to a market where the balance of forces remains evenly matched.
This analysis covers one dimension. Our full weekly report combines six specialist agents into a single actionable briefing with directional bias, key levels, and risk-opportunity matrix.
Start Free — Get the Market of the WeekFree weekly report · No credit card · Upgrade anytime



