Silver Key Levels This Week — Support, Resistance & Confluence Zones
Silver key levels breakdown: support zones, resistance zones, confluence and price structure.

Price Architecture
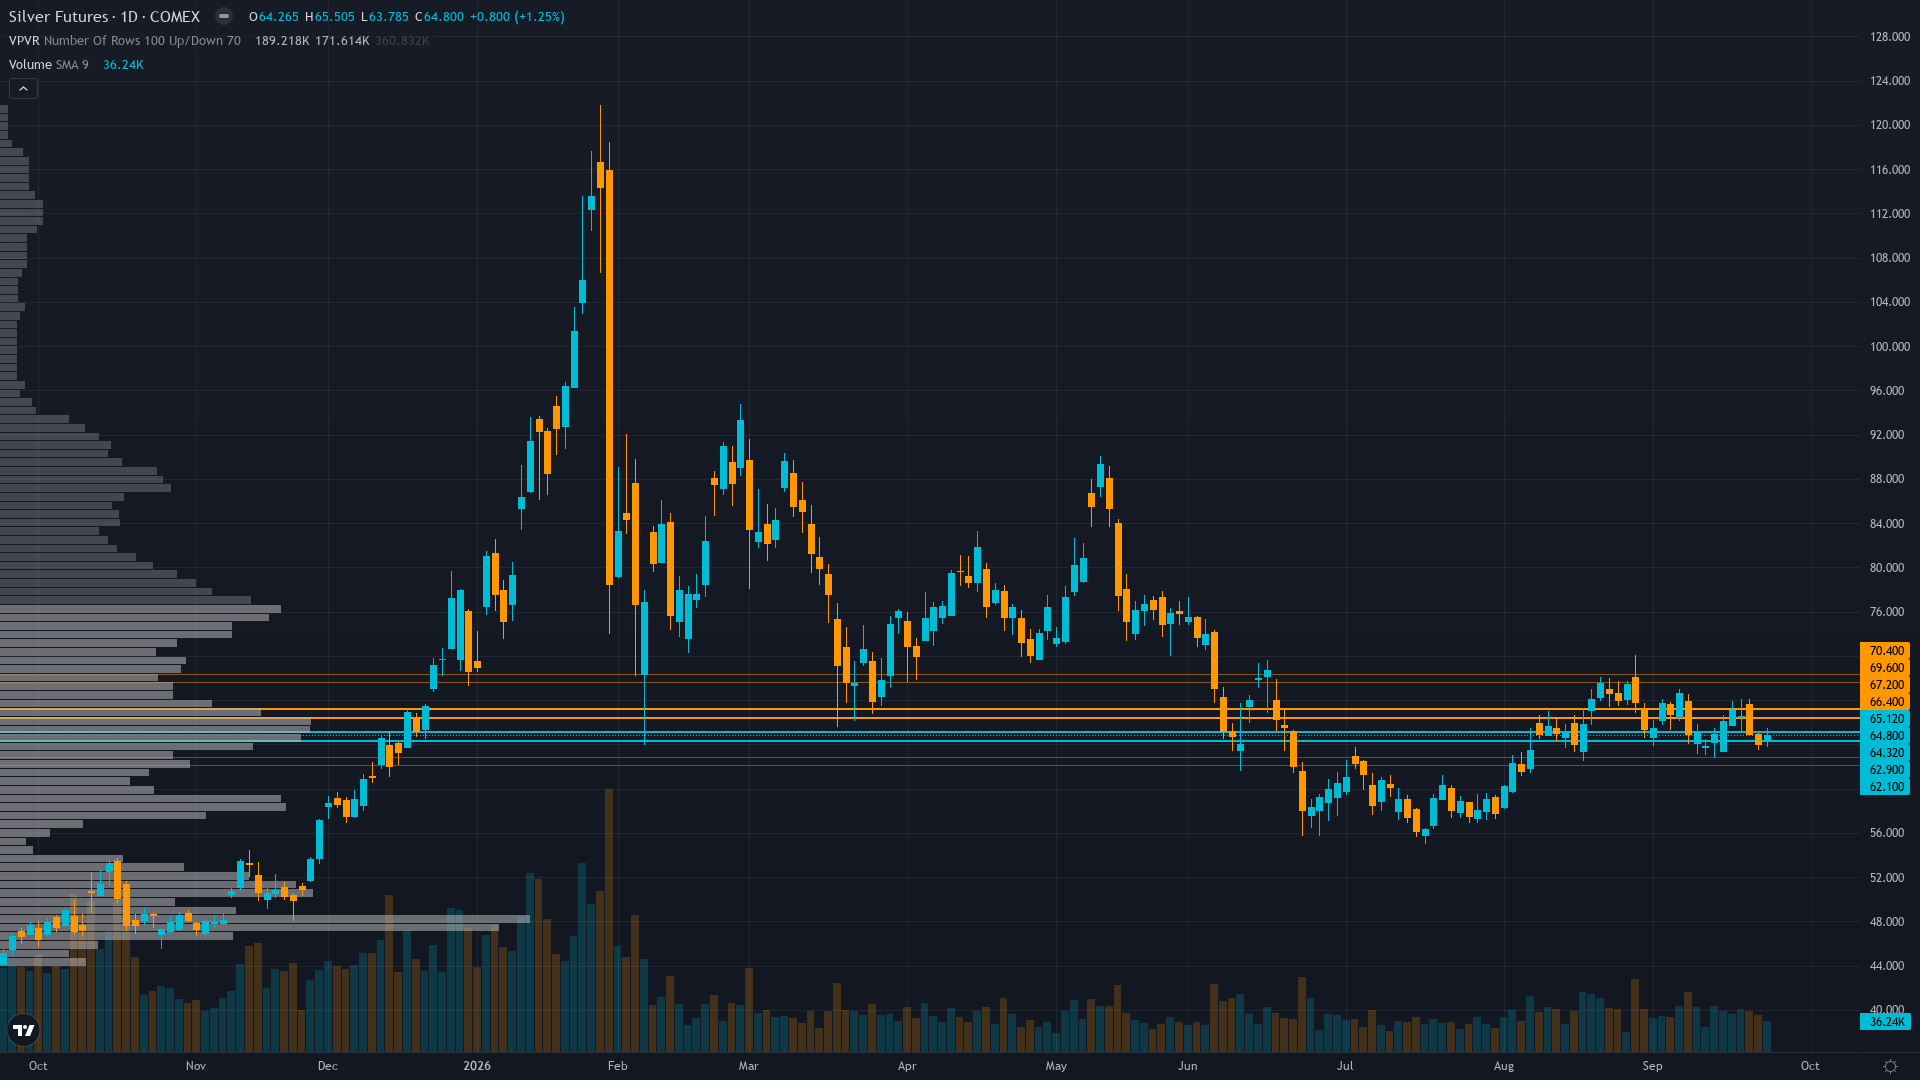
At 64.245, silver has inched 0.68% higher in a measured advance. The market in silver futures is coiling, with narrowing price ranges suggesting stored energy that will eventually release.
Silver consolidating in a $62.50-$66.00 range after the weekly sell-off from $66.56 to $64.25, with RSI at 47 indicating balanced momentum, volume thinning on the Sep 24 sell-off to $63.41 suggesting weak selling conviction, and price holding above the $62.50 support zone but failing to challenge $66 resistance
Trend strength is low at 3/10, indicating weak directional conviction and potential for range-bound behaviour.
Downside Protection
The downside architecture for SI futures features support zones rooted in prior buying activity. These are not arbitrary lines but areas where real capital has previously been committed.
The reliability of support under ranging conditions is shaped by the interplay between volatility regime and historical volume at each level.
Resistance Zone Context
The upside path for silver price is marked by resistance zones where prior selling activity created structural barriers. Clearing these zones requires either strong momentum or a shift in the fundamental picture.
In the current market state, resistance zones remain key decision points.
Analytical Convergence
The most actionable levels for silver are those where multiple analytical disciplines converge. When technical structure, institutional positioning, and options flow all point to the same zone, the probability of price reacting there increases meaningfully.
High vol regime with 33.6% annualised vol and daily ranges of 2-4% requires stops 6-8% below entry; the $62.50-$66.00 near-term range provides defined-risk breakout levels with the post-FOMC consolidation offering mean reversion potential; wide stops are necessary given silver's 5.79% average weekly move
Our Multi-Agent Approach to Key Levels
The levels in our paid reports are generated by six specialist agents working in parallel. Technical analysis provides the structural framework, institutional data shows where capital is committed, options flow reveals hedging behaviour, fundamentals anchor levels to value, sentiment gauges crowd positioning, and economic analysis times the catalysts.
The output is a curated set of levels with institutional-grade validation — the kind of multi-dimensional analysis that hedge fund research desks produce, delivered at a fraction of the cost.
Our paid reports include specific support and resistance levels identified by six specialist agents — technical structure, institutional positioning, options flow, fundamentals, sentiment, and economic analysis. Not just lines on a chart, but zones validated by multi-discipline confluence.
Start Free — Get the Market of the WeekFree weekly report · No credit card · Upgrade anytime


