Silver Forecast This Week — Outlook, Drivers & Key Levels
This week's Silver outlook: key drivers, volatility context, risk-opportunity assessment and the week ahead.

Where Things Stand
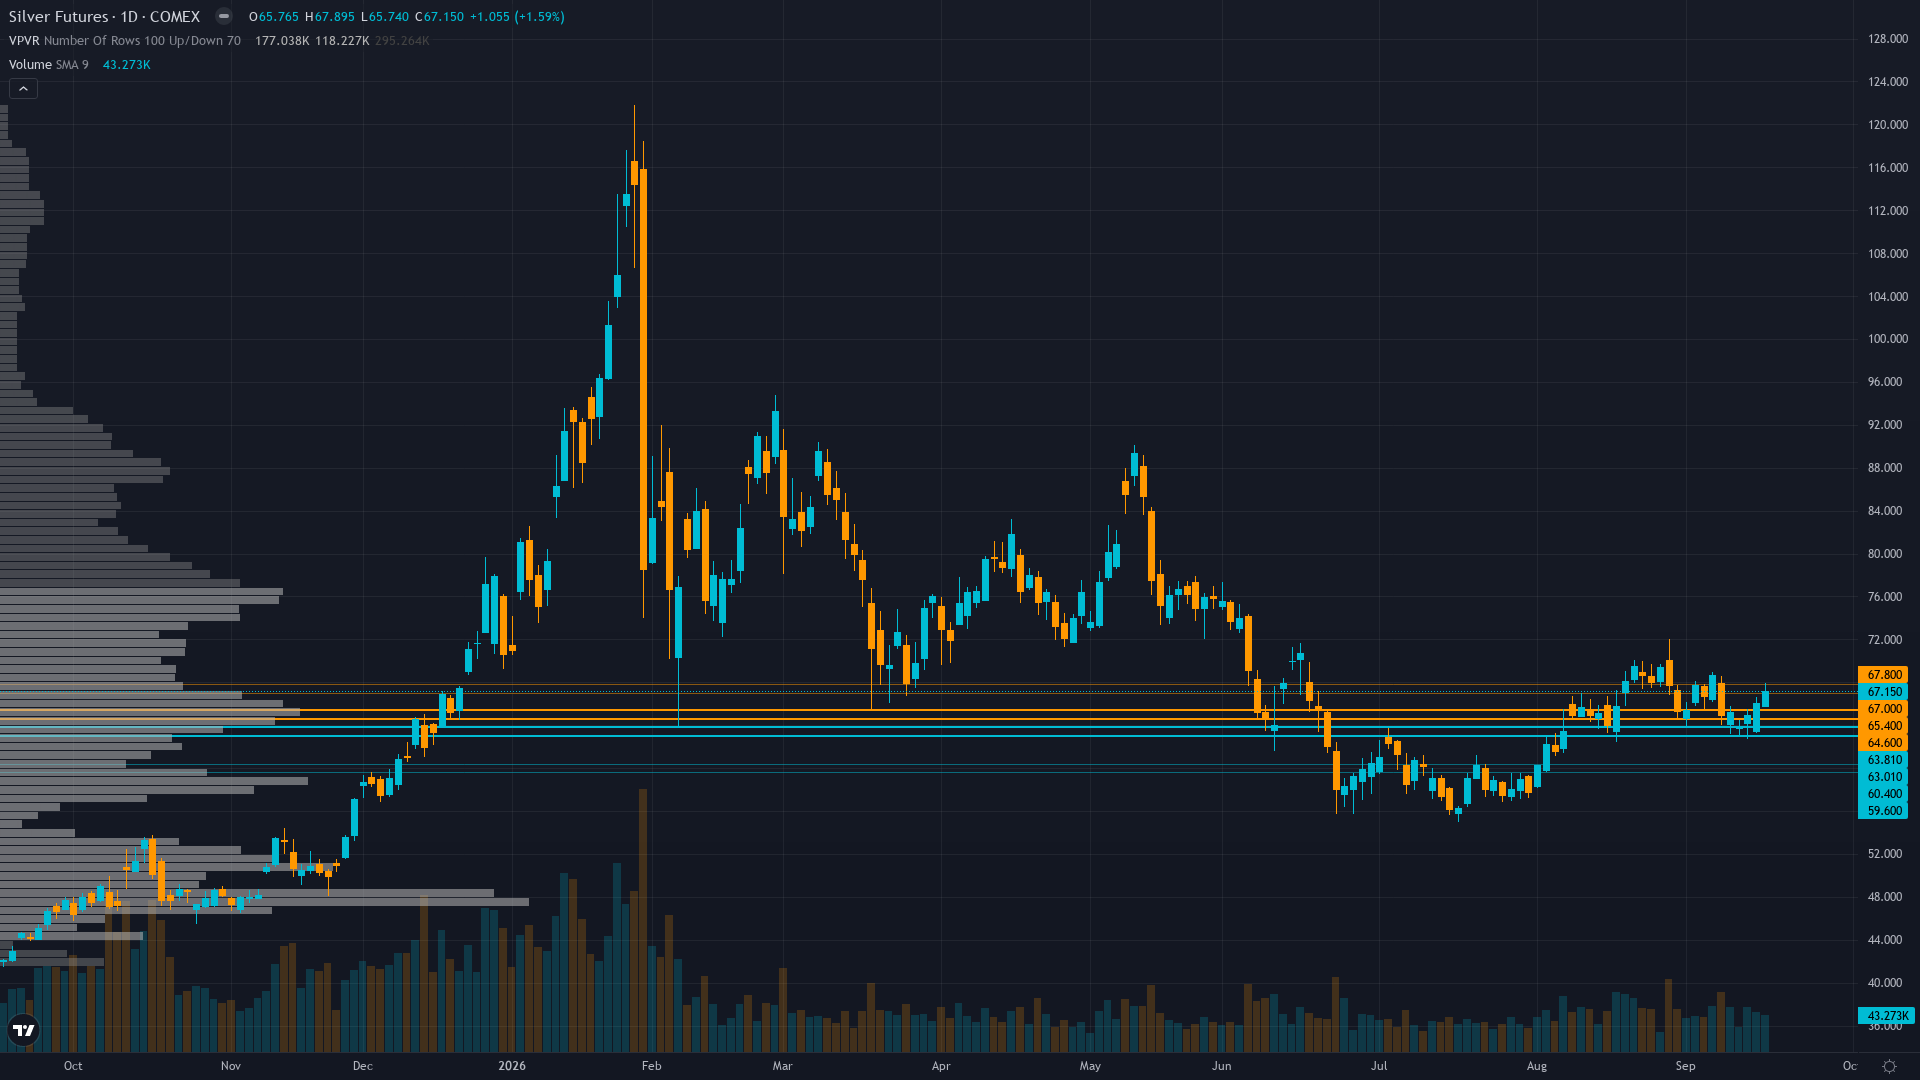
silver is trading at 66.556, essentially flat as the market digests recent moves. silver futures is consolidating, with price compressing into a narrower range as the market builds energy for its next move.
Market consensus is cautiously constructive post-FOMC hike — the rate increase was fully priced, and silver's recovery to $66.56 supports the 'sell the rumour, buy the fact' narrative, with CoinCodex algorithm projecting $70.71 by Sep 26 and GoldSilver emphasizing that institutional positioning at the 27.8th percentile provides asymmetric upside fuel, though sustained vigilance on real yields above 2.5% tempers bullish conviction
What's Driving Price
Primary driver: FOMC September 15-16 delivered the 25bp rate hike the market had priced at 80% probability, but silver recovered from the sell-off to $66.56 as the 'buy the rumour, sell the fact' dynamic played out — the hike itself was not the threat; what matters post-FOMC is whether the dot plot and real yields (10-year real at 2.55%) sustain the headwind or ease in coming weeks
Secondary factor: Structural deficit thesis remains intact for the sixth consecutive year (Silver Institute projects 46.3M oz shortfall for 2026), with cumulative above-ground stock drawdown of 762M oz since 2021 — physical lease rates spiked to 8% confirming acute scarcity, but the real-yield mechanism continues to set the paper price, keeping silver at roughly 1.4-1.5% of gold, well below the 2% structural floor that implies $88/oz at current gold prices (DiscoveryAlert Sep 5)
Additional influence: Institutional positioning at the 27.8th percentile of the 3-year range (CFTC COT Sep 15, non-commercial net 25,326 contracts) remains profoundly under-positioned for the structural deficit thesis — 80%+ of potential speculative buying has yet to occur, providing asymmetric upside fuel if the real-yield headwind eases, while the 85% retail long positioning (DailyFX) creates contrarian bearish risk if positioning unwinds
Economic backdrop: TRANSITIONAL with hawkish Fed skew: Fed hiked 25bp on Sep 16 to 3.75-4.00% as widely expected, 10Y Treasury at 5.01% (+5bp weekly), 10Y real yield at ~2.55%, inflation at 2.33%, unemployment 4.1%, VIX at 14.88 indicating equity complacency that diverges from precious metals headwinds — upcoming catalysts include Fed speeches (Goolsbee Sep 21, Williams/Jefferson/Barkin Sep 22) and PMI data (Sep 23)
Fundamental assessment: Silver appears undervalued by 20-25% versus J.P. Morgan's $81/oz 2026 average forecast and institutional year-end targets of $80-106, with sixth consecutive annual structural deficit and industrial demand from solar (175-185M oz) and electronics robust, but near-term price action remains hostage to real-yield direction post-FOMC
Chart Assessment
Silver consolidating in a $63.50-$66.80 range after the post-FOMC recovery from $64.55 to $66.56, trading near the 50-day and 200-day EMA confluence at $66.80 which represents critical resistance — a clean break above $66.80 opens the path toward $70 psychological resistance, while failure to hold above $64.72 immediate support risks retest of $62.50 zone
With trend strength at 4/10, the directional signal is present but far from decisive.
Volatility Context
At the 60th percentile, silver price volatility sits in a normal range, neither compressed enough to signal a breakout nor elevated enough to demand caution. Realised vol is declining steadily, compressing into ranges that tend to snap when a catalyst breaks the equilibrium.
High vol regime with 34.3% annualised vol and daily ranges of 2-4% requires stops 6-8% below entry; the $64.72-66.80 near-term range provides defined-risk breakout levels with the post-FOMC consolidation offering mean reversion potential; wide stops are necessary given silver's 5.79% average weekly move
Upside & Downside
Primary risk: Post-FOMC dot plot signals additional hikes ahead, sustaining 10-year real yields above 2.5% and keeping the dollar firm, which would reassert the real-yield headwind that has dominated silver pricing throughout 2026 — combined with 85% retail long positioning (DailyFX), a breakdown below $64.72 support could trigger long liquidation toward $62.50 and potentially $60.00 psychological level (Probability: medium)
Primary opportunity: The 25bp hike was fully priced and silver recovered immediately — if the dot plot proves less hawkish than feared or the October 14 CPI data shows further moderation, the real-yield headwind eases and silver's structural deficit thesis (46.3M oz shortfall, 27.8th percentile institutional positioning) could drive a recovery toward $70-75 as under-positioned specs re-enter, with CoinCodex algorithm projecting $70.71 by Sep 26 (Timeframe: 1-3 weeks through October CPI (Oct 14) if post-FOMC dot plot and real yields ease, enabling institutional re-positioning from the 27.8th percentile toward neutral)
This week's edge: The market may be under-pricing the structural implications of institutional positioning at the 27.8th percentile combined with a gold-silver ratio near 68:1 that values silver at just 1.4-1.5% of gold, well below the 2% historical floor implying $88/oz — the FOMC hike was fully priced, and the real-yield mechanism that has dominated silver pricing in 2026 may be nearing exhaustion as the market looks through this tightening cycle, but the 85% retail long positioning creates a two-way risk that limits the desk's conviction despite the compelling structural bull case
The Week Ahead
The S&P Global Manufacturing PMI (Sep) and Services PMI (Sep) — estimates 53.6 and 56.0 respectively — will provide the first post-FOMC read on economic activity, influencing whether the 25bp hike is viewed as a one-off adjustment or the start of a tightening cycle on Wednesday 23 September represents a mid-tier catalyst that could accelerate or stall the current directional thesis.
How silver navigates the confluence of consolidating conditions and incoming data will determine whether the current directional thesis holds or breaks.
This analysis covers one dimension. Our full weekly report combines six specialist agents into a single actionable briefing with directional bias, key levels, and risk-opportunity matrix.
Start Free — Get the Market of the WeekFree weekly report · No credit card · Upgrade anytime



