Silver Forecast This Week — Outlook, Drivers & Key Levels
This week's Silver outlook: key drivers, volatility context, risk-opportunity assessment and the week ahead.

Where Things Stand
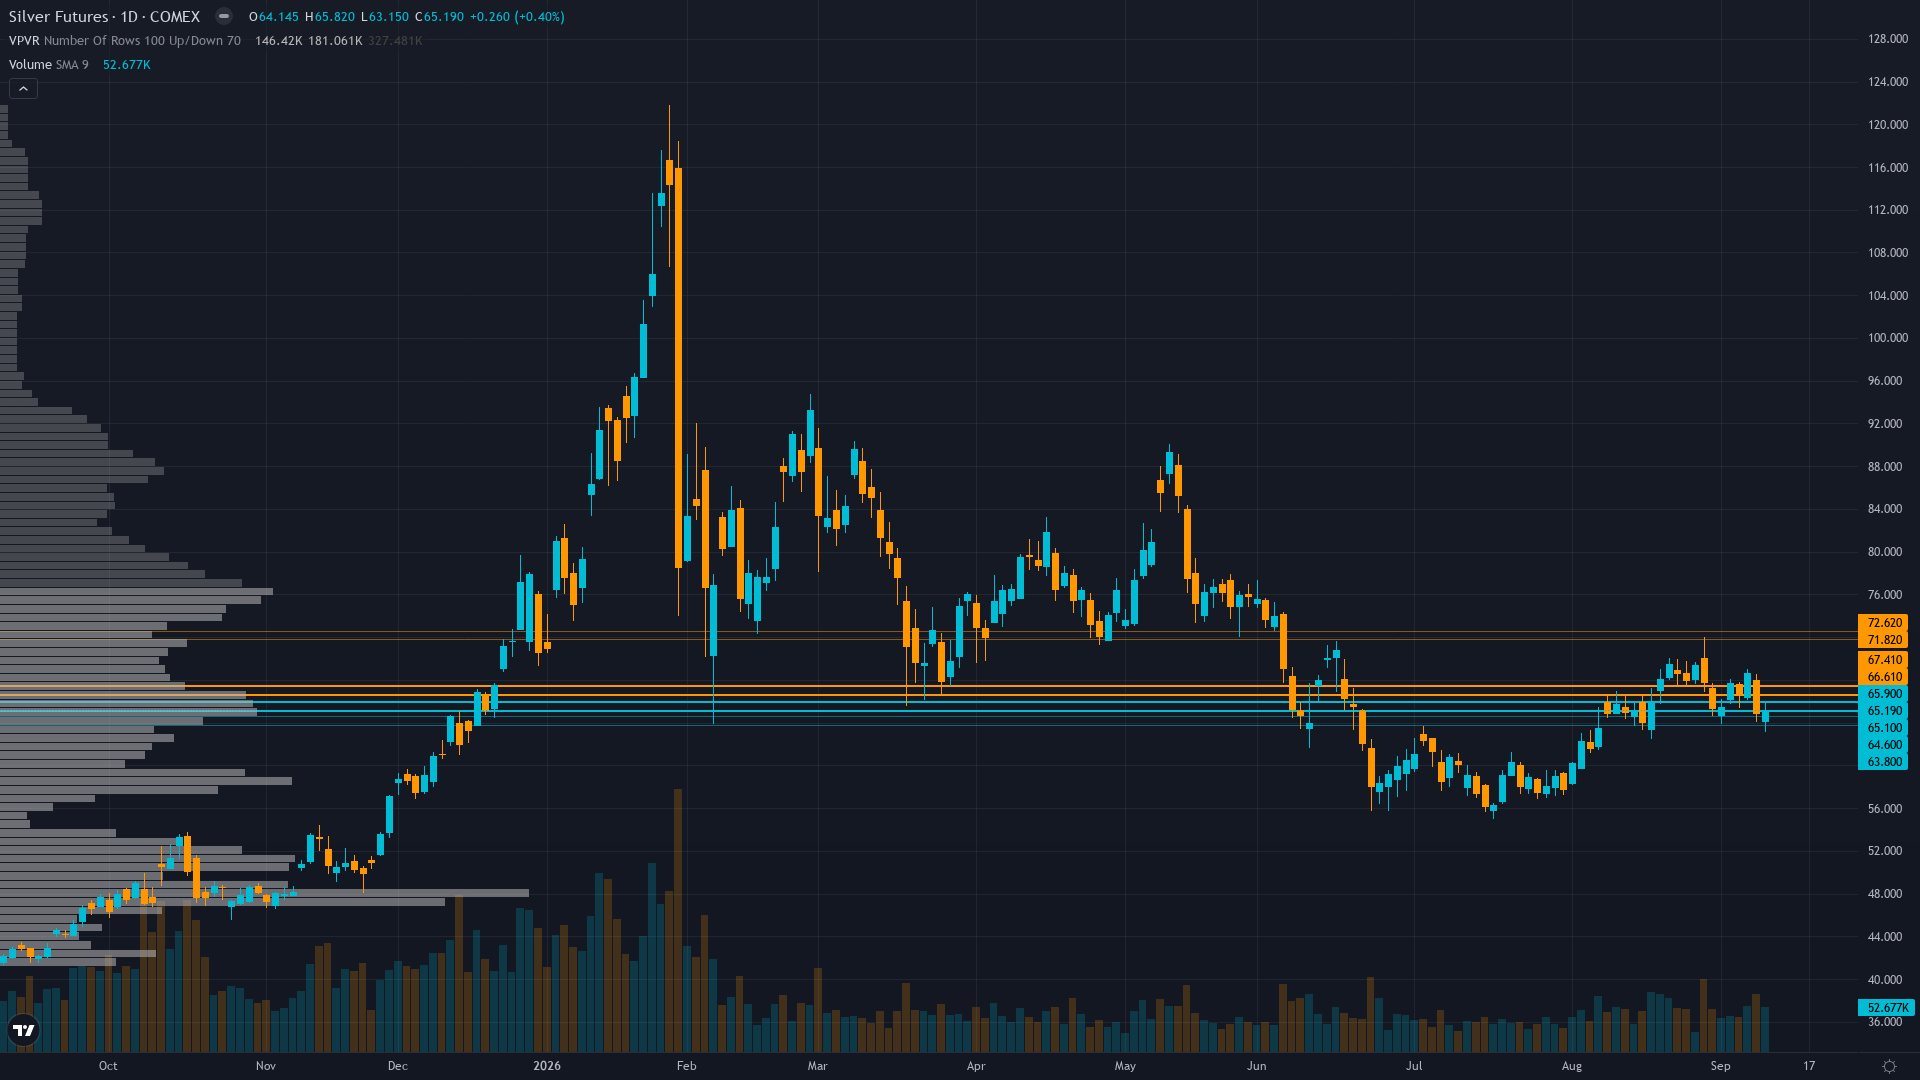
silver is trading at 64.554, down 1.13% as selling pressure weighs on price. silver futures is consolidating, with price compressing into a narrower range as the market builds energy for its next move.
Market consensus is uniformly bearish near-term with Polymarket pricing 80% probability of a 25bp September rate hike and CME FedWatch at 56-66% depending on date, but structural deficit bulls continue to argue that current $64.55 represents a buying opportunity with 25%+ upside to institutional year-end targets of $80-106 — the wide dispersion reflects binary FOMC uncertainty rather than directional conviction
Risk-Reward Assessment
Primary risk: FOMC delivers 25bp rate hike on Sep 16 with hawkish dot plot showing further tightening bias, sustaining 10Y yields above 5.0% and real yields at cycle highs, triggering breakdown below $63.41 support toward $60.00 psychological level as institutional positioning at 29.1st percentile provides no floor and ETF outflows accelerate — a move that could extend to $55-58 territory over 1-2 weeks (Probability: high)
Primary opportunity: FOMC surprises with a hold (21% probability per Polymarket) and Chair Warsh's tone acknowledges inflation moderation despite hot August CPI, causing violent short-covering rally from oversold conditions with institutional positioning at the 29.1st percentile providing asymmetric upside fuel for a recovery back toward $67-70 resistance as the structural deficit thesis reasserts and physical lease rates at 8% signal acute scarcity (Timeframe: 2-5 days post-FOMC if the Fed disappoints hawkish expectations with a hold decision and dovish dot plot revision, enabling silver to rally 5-10% as short-covering and institutional re-positioning flows accelerate)
This week's edge: The market may be fully pricing the hot August CPI into the 80% rate-hike probability, creating asymmetric upside risk if the FOMC delivers a 25bp hike but with a dovish dot plot that caps the hiking cycle — the 29.1st percentile institutional positioning provides fuel for a relief rally. However, the desk's measured calibration of 60% directional accuracy on SI and the genuine binary nature of the FOMC decision 3 days away mean this is a low-information-edge environment where the disciplined call is NO CALL, not a contrarian one
Forces in Play
Primary driver: August CPI (Sep 11) came in hot, pushing September FOMC rate-hike probability to 80% (Polymarket) and crushing silver from Sep 9 high of $67.40 to $64.54 — the hawkish monetary policy repricing overwhelms all other drivers 72 hours ahead of the Sep 16 FOMC decision
Secondary factor: Structural deficit thesis remains intact for sixth consecutive year (Silver Institute projects 46.3M oz shortfall) with physical lease rates spiking to 8% indicating acute scarcity, but this medium-term fundamental is entirely neutralised by the immediate rate-hike threat that directly impacts silver via real yields and USD strength
Additional influence: Gold/silver ratio widened to approximately 67.6:1 (Sep 11) from the 61.7 level in June, with silver underperforming gold as its industrial profile makes it more exposed to rate-hike anxiety — the ratio's 12-week round trip from 61.7 to 70.4 and back to 66.3 reflects silver's higher-beta sensitivity to monetary policy swings
Economic backdrop: TRANSITIONAL macro with hawkish Fed skew: August CPI hot (Sep 11) driving September FOMC rate-hike probability to 80% (Polymarket) from 56% (Sep 8 CME FedWatch), 10Y Treasury surged +18bp to 4.96%, Fed funds at 3.63%, inflation at 2.36%, unemployment 4.1%, VIX at 15.84 indicating equity complacency that diverges from precious metals pressure — retail sales and FOMC Economic Projections on Sep 16 are the critical catalysts
Fundamental assessment: Silver appears moderately undervalued at $64.55 versus J.P. Morgan $81/oz 2026 average forecast and institutional year-end targets of $80-106, with sixth consecutive annual structural deficit and industrial demand from solar (175-185M oz) and electronics robust, but near-term completely overwhelmed by rate-hike threat and rising real yields
Technical Landscape
Downtrend continuation with silver at $64.55 trading below all key moving averages after -3.61% weekly decline, RSI approaching oversold but not confirmed, immediate resistance at $65.00 round number and major resistance at $73.00 prior swing high, support at $63.41 daily range low then $60.00 psychological level
Trend strength is low at 3/10, indicating weak directional conviction and potential for range-bound behaviour.
Volatility Backdrop
silver price volatility at the 60th percentile reflects a balanced environment where standard risk parameters apply. Volatility remains anchored at current levels, with no clear signal of an imminent regime shift in either direction.
High vol regime with 38.2% annualised vol and daily ranges of 2-4% requires stops 6-8% below entry; the $63.41-65.00 near-term range provides defined-risk breakout levels with FOMC binary catalyst on Sep 16; wide stops are necessary given the event-driven nature of expected moves
The Week Ahead
Retail Sales MoM (Aug) at 12:30 ET estimate +0.9% vs prior -0.6%, followed by FOMC Economic Projections and interest rate decision at 18:00 ET on Sep 16 — the joint release of (1) potentially strong retail sales supporting a hawkish Fed, (2) the FOMC rate decision with 80% probability of a 25bp hike, and (3) updated dot plot and economic projections will determine silver's trajectory into late September on Wednesday 16 September is a high-impact catalyst with the potential to redefine the near-term outlook entirely.
How silver navigates the confluence of consolidating conditions and incoming data will determine whether the current directional thesis holds or breaks.
This analysis covers one dimension. Our full weekly report combines six specialist agents into a single actionable briefing with directional bias, key levels, and risk-opportunity matrix.
Start Free — Get the Market of the WeekFree weekly report · No credit card · Upgrade anytime



