Silver Forecast This Week — Outlook, Drivers & Key Levels
This week's Silver outlook: key drivers, volatility context, risk-opportunity assessment and the week ahead.

Where Things Stand
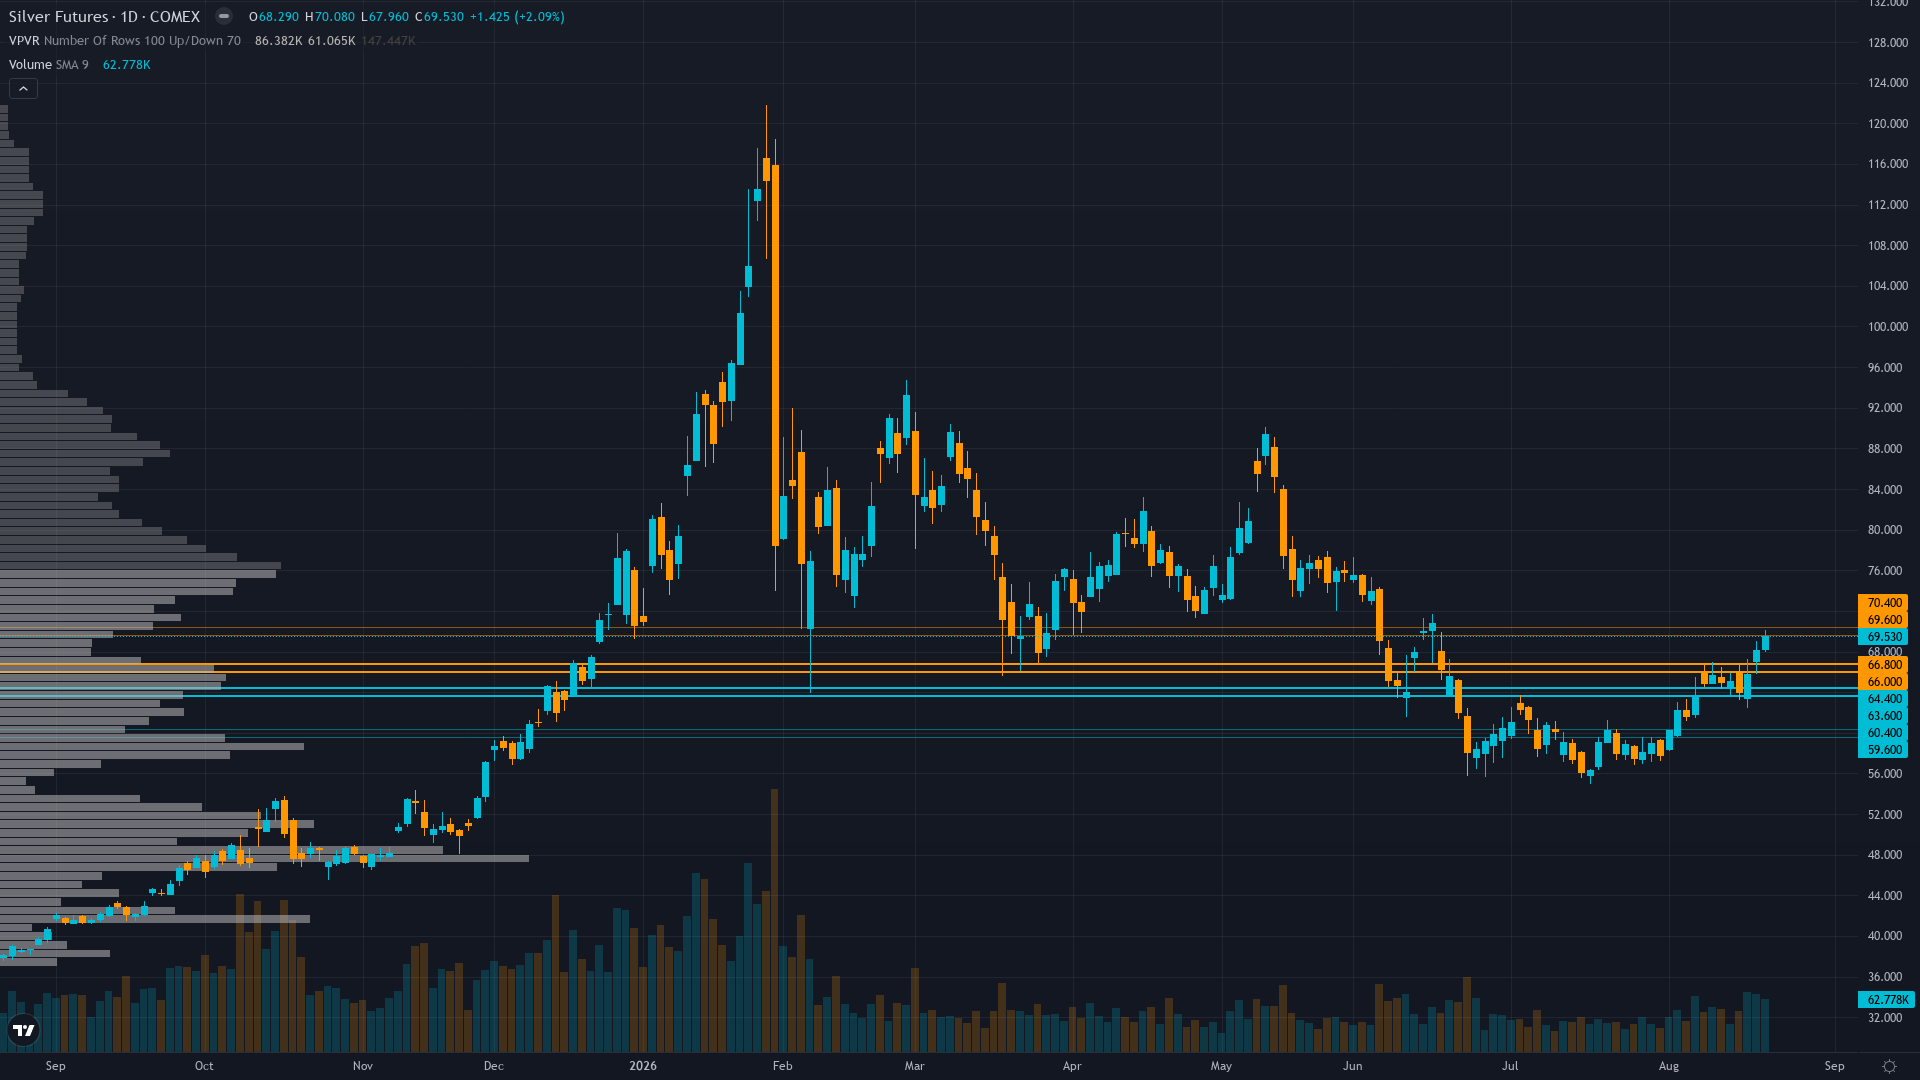
silver is trading at 69.466, up a modest 0.27% as the market edges higher. silver futures is in a breaking out market state, requiring careful assessment of current conditions.
Market consensus is rapidly converging from cautious to bullish on silver's macro pivot, with CoinCodex algorithm projecting +8.86% to $73.83 by August 26, GoldSilver calling silver 'barely owned' at speculative 20th percentile, J.P. Morgan maintaining $81/oz 2026 average target, and Indian market premiums doubling reflecting strong physical demand, though some analysts still treat the rally as tactical within an intact bear trend rather than a structural regime change
What's Driving Price
Primary driver: Macro regime change from NFP-driven Fed dovish repricing continues to power silver's recovery rally (+20.19% monthly) as the July 7 NFP -23K shock (first outright payrolls decline since before 2025) and subsequent cooling inflation data have structurally removed the real-yield headwind that drove silver's -48% correction from January's $121.64 ATH to June's $55.70 low, with the dollar weakening (DXY trending down) and real yields compressing (2Y at 4.24%, 10Y at 4.74%) creating sustained monetary policy tailwind for non-yielding silver
Secondary factor: Institutional positioning at the 17.7th percentile of its 3-year range (CFTC COT August 18, 2026) remains profoundly under-positioned relative to the macro regime change, with non-commercial net long of only 23,625 contracts (19.7% of OI) providing massive asymmetric upside fuel as managed money has room to add 3-4x current length before reaching historical extremes - the GoldSilver August 19 analysis describes silver as 'barely owned,' confirming that institutional re-positioning flows have barely begun
Additional influence: Fundamental structural deficit thesis (sixth consecutive annual deficit projected at 46.3-67M oz per Silver Institute) now fully supported by monetary policy tailwinds for the first time since the June 17 Warsh FOMC hawkish pivot, with silver at $69.47 trading approximately 15-20% below J.P. Morgan's $81/oz 2026 average projection and below institutional year-end targets of $90-$106/oz, while industrial demand from solar (175-185M oz) and electronics remains robust and primary silver production hits new lows at 26% of total output
Economic backdrop: RISK-ON MACRO: VIX at 15.87 signaling low fear, USD weakening (DXY trending down), Fed on hold at 3.63% with inflation at 2.34% supporting rate-cut expectations, July PPI and soft CPI data have cemented dovish trajectory following July NFP -23K shock, 2Y at 4.24%, 10Y at 4.74%, curve 2s10s steep at 50bp, upcoming Core PCE MoM August 26 (est 0.2% vs prev 0.1%) and CB Consumer Confidence August 25 as key catalysts
Fundamental assessment: Silver moderately undervalued at $69.47 trading 15-20% below J.P. Morgan's $81/oz 2026 average and below $90-106 institutional year-end targets, sixth consecutive year of structural deficit (46.3-67M oz 2026 shortfall), industrial demand from solar (175-185M oz) and electronics growing while supply growth constrained with primary silver production at 26% of total output - deficit thesis now supported by monetary policy tailwind for first time since June 17 Warsh hawkish pivot
Chart Assessment
Strong bullish daily trend structure with silver at $69.47 well above the 200-day EMA at $65.43 following the confirmed breakout above $66.40 resistance on August 20, 2026, RSI at 65.4 indicating bullish momentum without overbought conditions, measured move target toward $75.00, with immediate resistance at psychological $70.00 round number and support at the $66.40 breakout level then $61.08 at 50-day EMA confluence
Trend strength registers 8/10 — a reading that suggests the directional impulse has real staying power.
Risk & Opportunity
Primary risk: Rejection at the psychological $70.00 resistance level following this week's +6.89% surge could trigger profit-taking back toward the $66.40 breakout support or $61.08 50-day EMA confluence level, especially if Core PCE on August 26 surprises to the upside above 0.2% MoM, reigniting hawkish Fed fears and strengthening the dollar, which would stall the institutional re-positioning flows that provide the primary upside fuel (Probability: medium)
Primary opportunity: Continued institutional re-positioning from the 17.7th percentile speculative extreme toward neutral positioning over the coming 2-6 weeks as the macro regime change (Fed dovish pivot, weakening USD, falling real yields) fully prices in, combined with seasonal August-February bull window (60-62.5% positive close rate historically per Discovery Alert), silver's structural deficit fundamentals (15-20% below fair value), and August 26 Core PCE and CB Consumer Confidence providing potential dovish catalysts, driving sustained recovery toward $75-80 resistance representing 8-15% additional upside (Timeframe: 2-6 weeks through September FOMC if inflation continues moderating and labor data remains weak, enabling Fed to signal policy flexibility that extends silver's re-rating toward structural fair value targets of $79-81 (J.P. Morgan) and $90-106 (institutional consensus year-end))
This week's edge: The market is underestimating the structural implications of institutional positioning at the 17.7th percentile of its 3-year range combined with a confirmed macro regime change (Fed dovish pivot, weakening USD, falling real yields) - most consensus models still treat silver's +20.19% monthly rally as a tactical short-covering bounce within an intact bear trend, when the evidence points to the first leg of a multi-week institutional re-positioning cycle that has barely begun, with 80%+ of speculative buying capacity still available to enter. The fundamental deficit thesis (sixth consecutive year, 15-20% below fair value) now has monetary policy tailwinds for the first time since January's ATH, and the combination of washed-out positioning + macro tailwinds + structural deficit + seasonal strength creates asymmetric upside that algorithmic forecasts (projecting $73.83 one week ahead) are only beginning to capture in their near-term projections
Volatility Backdrop
silver price volatility at the 65th percentile reflects a balanced environment where standard risk parameters apply. Volatility contraction continues, building the stored energy that typically precedes the next significant directional move.
High but contracting vol regime requires stops 6-8% below entry versus normal 4-5%, with daily ranges of 2-4% still elevated but normalizing; breakout above $66.40 resistance is a reliable continuation signal toward $70-75, while a close below $66.40 would indicate short-term exhaustion but does not invalidate the broader macro thesis given 17.7th percentile positioning provides re-entry support
The Week Ahead
CB Consumer Confidence (Aug) at 2:00 PM ET - estimate 90.3 vs previous 90.8, followed by Core PCE Price Index MoM (Jul) on August 26 at 12:30 PM ET (est 0.2% vs prev 0.1%), which represents the Fed's preferred inflation gauge and could cement or challenge the dovish trajectory driving silver's rally on Tuesday 25 August is a high-impact catalyst with the potential to redefine the near-term outlook entirely.
How silver navigates the confluence of breaking out conditions and incoming data will determine whether the current directional thesis holds or breaks.
This analysis covers one dimension. Our full weekly report combines six specialist agents into a single actionable briefing with directional bias, key levels, and risk-opportunity matrix.
Start Free — Get the Market of the WeekFree weekly report · No credit card · Upgrade anytime



