Silver Forecast This Week — Outlook, Drivers & Key Levels
This week's Silver outlook: key drivers, volatility context, risk-opportunity assessment and the week ahead.

Where Things Stand
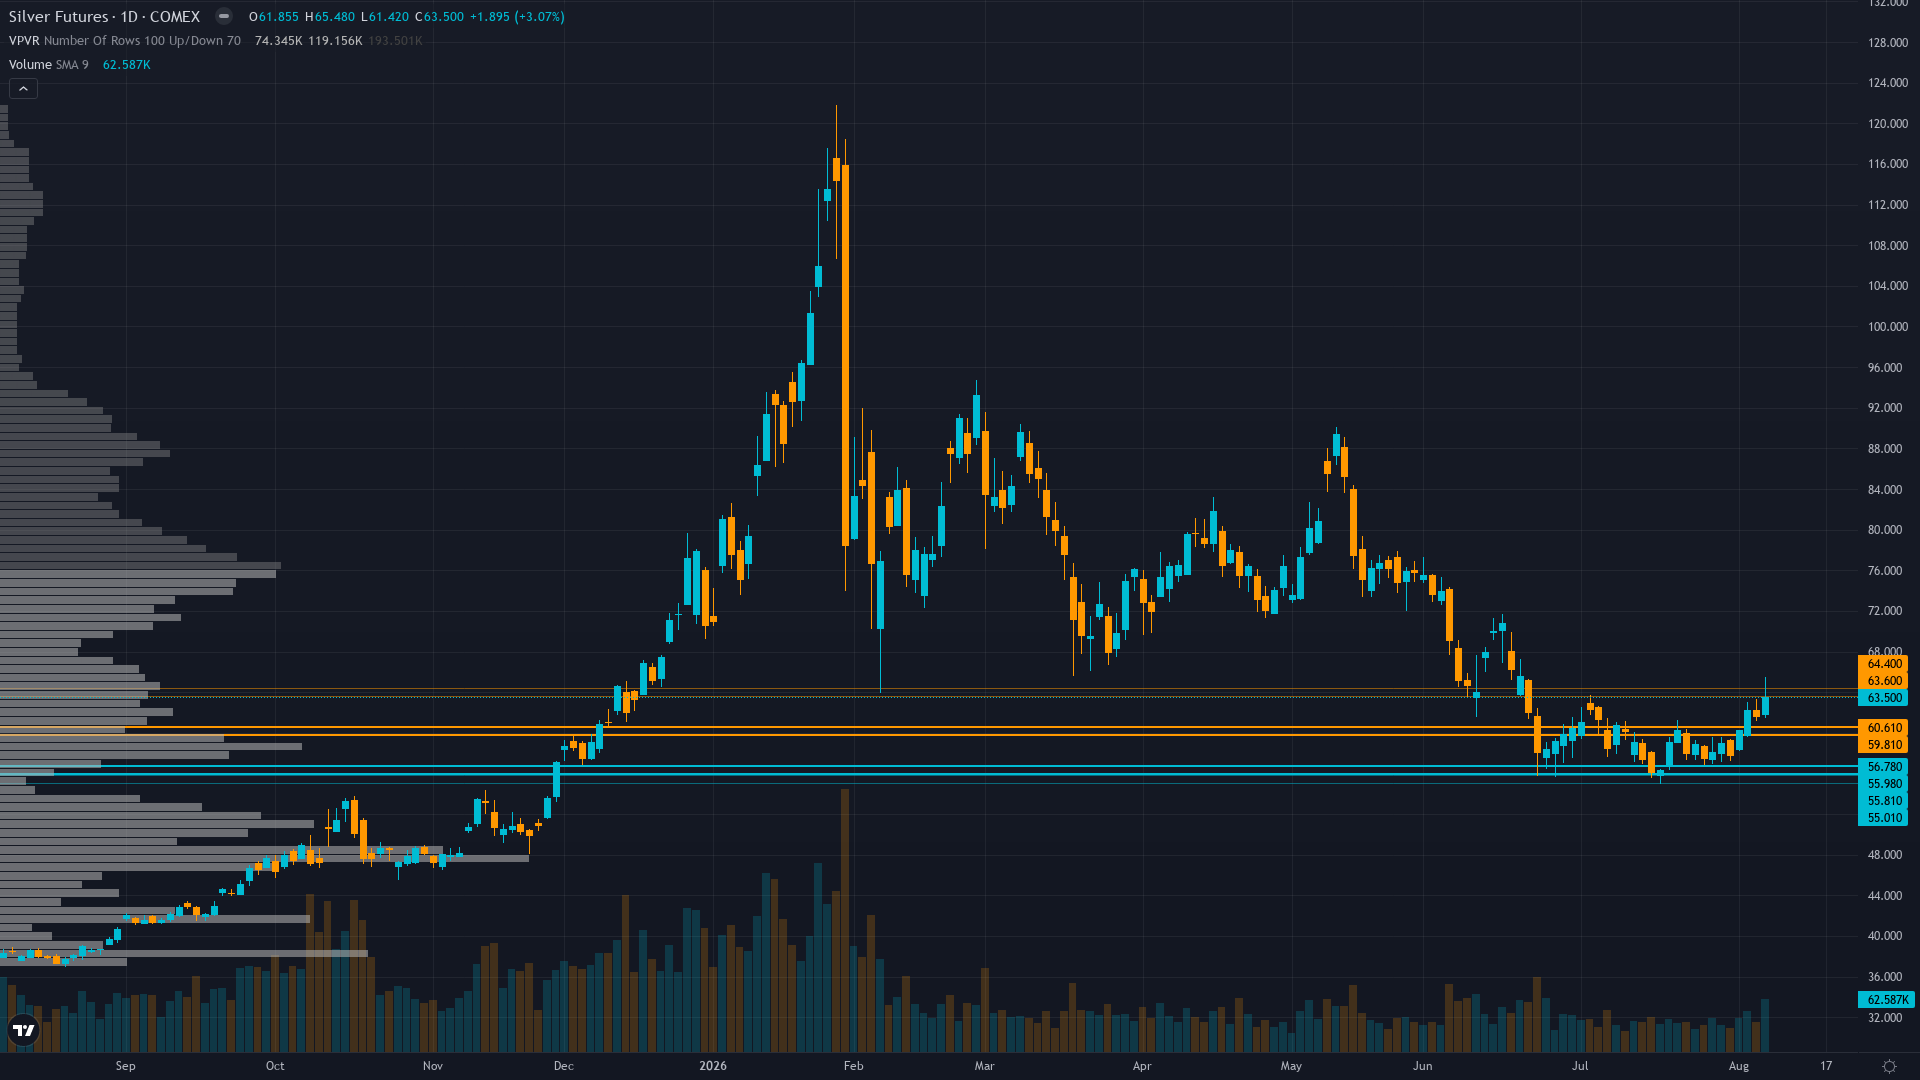
Trading at 63.332 after a 3.32% move higher, silver continues to attract buying interest. silver futures is in a breaking out market state, requiring careful assessment of current conditions.
Market consensus shifting rapidly from cautious bearish to bullish after July NFP -23K shock, with CoinCodex algorithm predicting +13.09% to $71.87 by August 14 and Discovery Alert noting August seasonal patterns with 60-62.5% positive close rates, though CBS News analysts note $50s floor still possible and LiteFinance forecasts $58.46 August average, reflecting wide dispersion before July CPI confirmation
What's Driving Price
Primary driver: July NFP catastrophic miss of -23K on August 7 (vs +80K consensus, first outright payrolls decline in months) triggered violent repricing of Fed rate expectations, crashing the dollar to 2-week lows and collapsing Treasury yields, removing the primary headwind that had driven silver's -48% correction from January's $121.64 ATH to June's $55.70 low
Secondary factor: Macro regime shift from hawkish Fed dominance to potential dovish pivot: July NFP -23K follows June's downwardly revised +20K (from +57K), creating back-to-back catastrophic labor data that forces the Fed to reconsider higher-for-longer stance at September FOMC, with market now pricing aggressive cuts into 2027
Additional influence: Fundamental structural deficit thesis (6th consecutive year at 67M oz shortfall per Silver Institute April 2026) now has monetary policy tailwind instead of headwind for first time since June 17 Warsh FOMC hawkish pivot, as falling real yields and weaker USD remove the key obstacle to silver's fair value re-rating toward JP Morgan's $81/oz and LBMA's $79.57 consensus target
Economic backdrop: TRANSITIONAL RISK-ON: VIX at 15.15 signals complacency, July NFP -23K (first decline since 2024) vs +80K expected, unemployment 4.1%, inflation cooling to 2.25% (August 7), 10Y yield at 4.65% (-10bp 1w), real yields compressing as labor market deterioration forces Fed pivot expectations, CPI release August 12 next catalyst
Fundamental assessment: Silver 21% below JP Morgan $81/oz fair value and 20% below LBMA $79.57 analyst consensus, with sixth consecutive year of structural deficit (67M oz 2026 shortfall) now supported by weakening USD and declining real yields removing the primary headwind that previously overwhelmed the deficit thesis
Chart Assessment
Bullish breakout after finding support at $57.00, surging through $60 resistance and $62 consolidation zone, now testing $65.05 intraday high (August 7) as RSI moves into bullish momentum territory above 60, establishing higher low structure with volume surging on breakout above prior $60 resistance ceiling
With trend strength at 6/10, there's a clear directional tilt but room for the move to develop further.
Risk & Opportunity
Primary risk: CPI surprise to upside on August 12 (headline above 3.5%) reignites Fed hawkish fears, reversing the NFP-driven dollar weakness and real yield compression, triggering profit-taking from the +9.97% weekly surge with a retest of $60 support and potential failure of the breakout if hotter-than-expected inflation invalidates the stagflation narrative (Probability: medium)
Primary opportunity: Continued NFP-driven repricing toward silver's structural fair value of $79-81 as falling real yields and weaker USD combine with washed-out speculative positioning at 13th percentile to produce a sustained multi-week recovery rally of 15-25% from current $63.33 toward $70-75 resistance over the next 2-4 weeks, with CPI confirmation on August 12 providing the next catalyst leg (Timeframe: 2-4 weeks through August CPI and into September FOMC if labor data continues weakening and inflation confirms moderation trajectory)
This week's edge: The market is treating the NFP-driven surge as a tactical short-covering bounce within an intact bear trend, but the desk sees a structural regime change: back-to-back catastrophic labor data (June +20K revised from +57K, July -23K) combined with cooling inflation at 2.25% forces the Fed toward cuts that would remove the real yield headwind that drove silver's -48% correction, while speculative positioning at the depressed 13.3rd percentile of the 3-year range means institutional reinvestment into silver has barely begun — the breakout above $65 this week is likely the first leg of a multi-week re-rating toward structural fair value of $79-81 that consensus algorithmic models still do not price
Volatility Backdrop
silver price is in a high-volatility environment (75th percentile over 90 days), where position sizing discipline becomes critical. Volatility remains anchored at current levels, with no clear signal of an imminent regime shift in either direction.
High vol regime requires stops 8-12% below entry versus normal 4-6% with 4-7% daily ranges typical; breakout above $65 intraday high (August 7) becomes reliable continuation signal toward $68-70 if sustained, while failure to hold above $60-62 would indicate false breakout though washed-out positioning argues against deep retracement
The Week Ahead
July CPI release at 12:30 ET — headline expected +0.1% MoM to 334.03 from 333.95, core expected 2.5% YoY (from 2.6%) — cooling inflation combined with collapsing payrolls would cement dovish September FOMC expectations and extend silver's rally toward $68-70 resistance on Wednesday 12 August is a high-impact catalyst with the potential to redefine the near-term outlook entirely.
How silver navigates the confluence of breaking out conditions and incoming data will determine whether the current directional thesis holds or breaks.
This analysis covers one dimension. Our full weekly report combines six specialist agents into a single actionable briefing with directional bias, key levels, and risk-opportunity matrix.
Start Free — Get the Market of the WeekFree weekly report · No credit card · Upgrade anytime



