Silver Forecast This Week — Outlook, Drivers & Key Levels
This week's Silver outlook: key drivers, volatility context, risk-opportunity assessment and the week ahead.

Where Things Stand
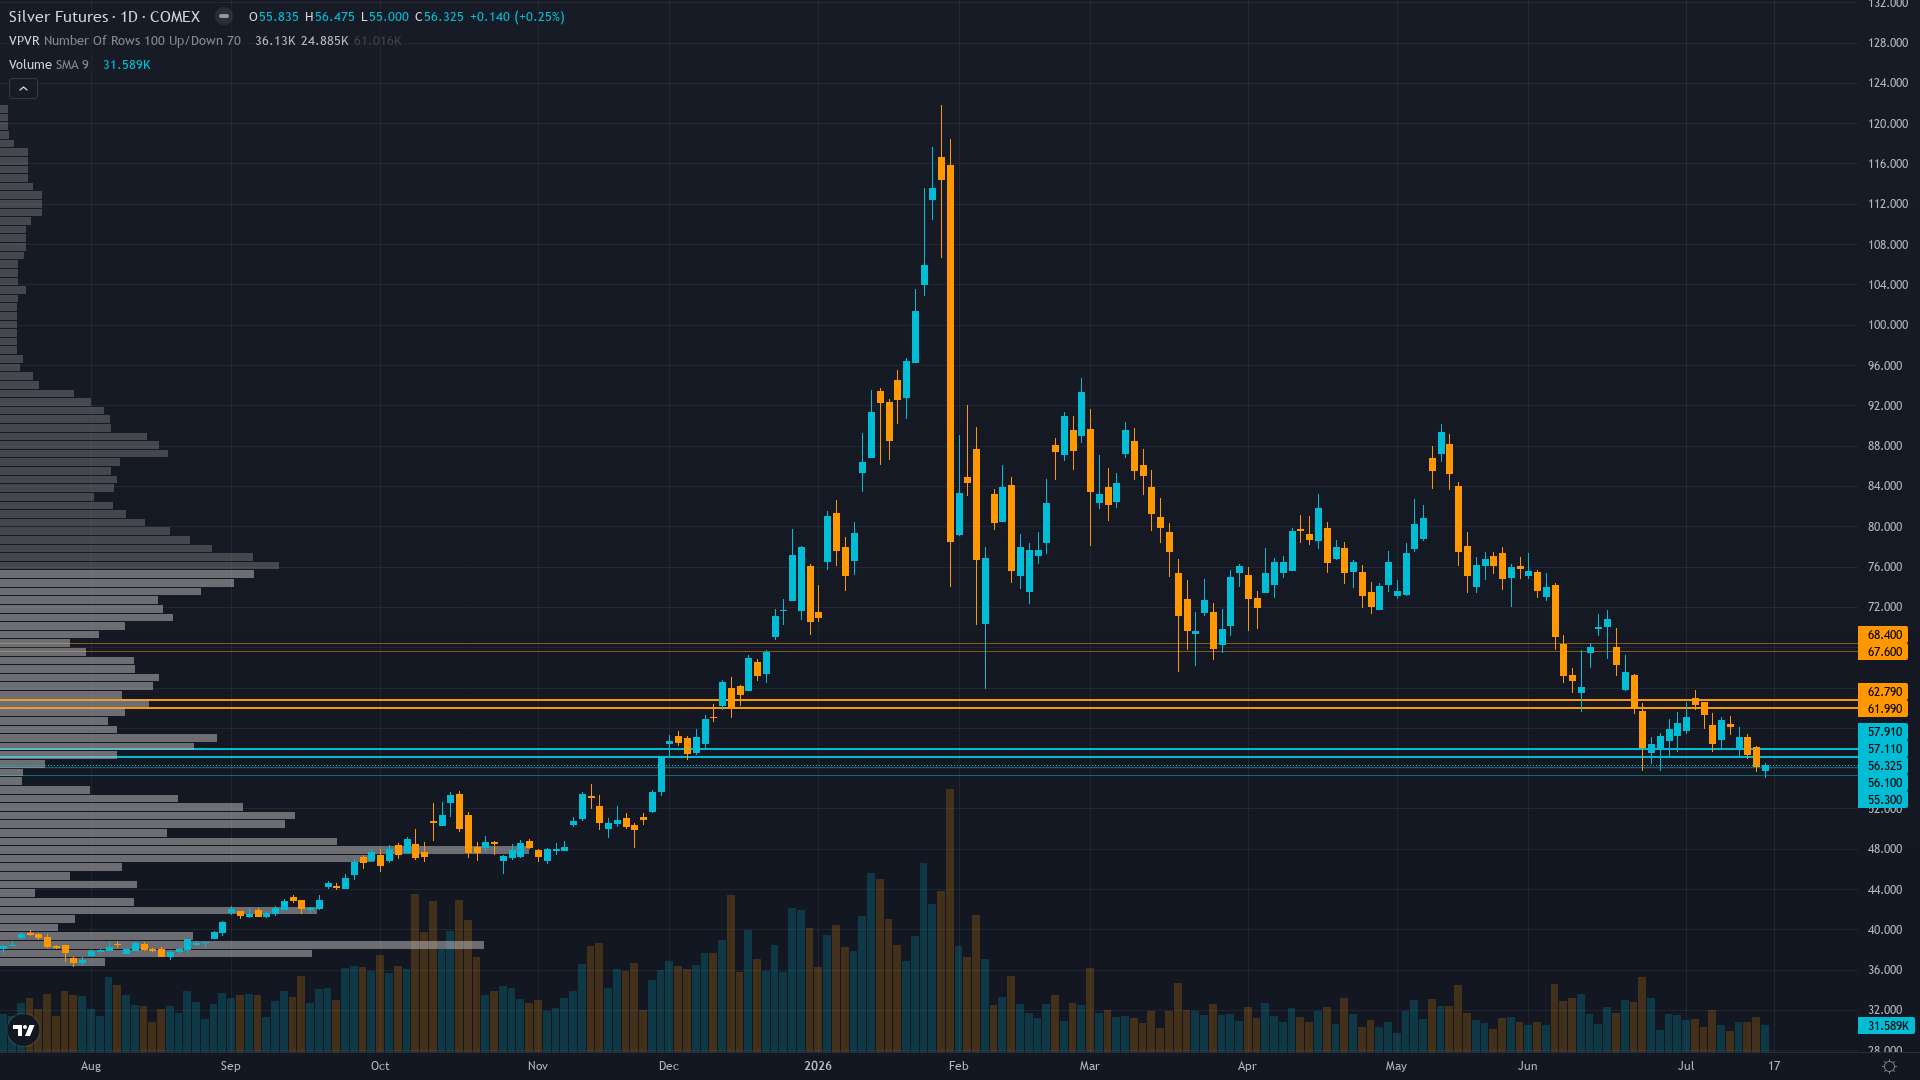
silver fell to 56.38 on a 3.00% decline, with selling pressure dominating price action. silver futures is in a breaking down market state, requiring careful assessment of current conditions.
Market consensus fractured between structural deficit bulls targeting $68-79 recovery on intact sixth-year deficit fundamentals and gold-silver ratio at 69.2:1 peak arguing 20-42% undervaluation versus consensus $79.57/oz, versus cautious bears with CoinCodex algorithm predicting -8.81% decline to $50.67 by July 23 suggesting continued algorithmic bearish lean, wide dispersion reflecting July 29 FOMC binary uncertainty
What's Driving Price
Primary driver: June 14 CPI dovish surprise (-0.4% MoM headline, 0.0% core) delivered temporary relief by reducing July 28-29 FOMC rate hike probability from 42% to 17%, but last week's continuation breakdown from $60.17 to $56.38 (-6.3%) validates ninth consecutive BEARISH week as sustained dollar strength (DXY near 13-month highs) and real yields above 2.17% continue to overwhelm sixth-year structural deficit fundamentals
Secondary factor: Ninth consecutive week of BEARISH bias now exceeding 8-week Bias Review threshold by one week requiring re-justification from first principles per Rule 4 Step 4, yet core thesis remains empirically validated: measured 61% weekly directional accuracy and +2.25R average return demonstrate Fed monetary policy trajectory via real yields above 2.0% mathematically dominates sixth-year 67M oz deficit (59% industrial demand) until July 28-29 FOMC provides directional clarity on rate path
Additional influence: Post-liquidation institutional positioning at mid-range creates asymmetric setup where managed money washed-out limits further smart money selling but Technical breakdown to 8-month lows at $56.30 testing $55.41 critical support ahead of July 28-29 FOMC (9 days away) creates binary risk unsuitable for conviction above minimum threshold despite GoldSilver.com July 14 reporting gold-silver ratio at 69.2:1 near historical peak arguing silver undervalued 20-42% versus consensus $79.57/oz
Economic backdrop: Fed on hold at 3.50-3.75% after June 17 FOMC where 9-of-18 members projected potential rate hikes per GoldSilver.com July 8 reporting FOMC minutes reveal committee split, June 14 CPI dovish surprise (headline -0.4% MoM largest monthly decline since April 2020, core 0.0%) reduced July 28-29 hike probability from 42% to 17% per Polymarket but sustained real yields at 2.17% (10Y TIPS) and DXY near 13-month highs create headwind, VIX 15.67 below 20 threshold indicates risk-on yet precious metals selling validating monetary policy dominance
Fundamental assessment: Sixth consecutive year of 67M oz structural deficit with 59% industrial demand from solar/EV/AI sectors fundamentally intact per Silver Institute April 15 report, current $56.38 trades 29-41% below fair value estimates of $79.57 consensus (LBMA 2026 analyst average) implying 42% upside, yet near-term overwhelmed by June 17 Fed Chair Warsh hawkish pivot sustaining real yields above 2.17% creating mathematical headwind for non-yielding assets despite physical scarcity providing medium-term floor above $50-55
Chart Assessment
Downtrend accelerating with price at $56.38 down -6.3% last week from $60.17 testing 8-month lows at $56.30 documented by Technical Agent July 19, trading 25% below 50-day MA (~$75.71) and 18% below 200-day MA (~$68.77), RSI 41 bearish momentum without oversold extremes, breakdown structure confirmed with series of lower highs and lower lows since January $121.79 ATH representing -54% correction, immediate support $55.41 weekly low critical then major $50.00 psychological level
With trend strength at only 2/10, any directional bias is thin and easily disrupted.
Risk & Opportunity
Primary risk: July 28-29 FOMC reinforces June 17 hawkish stance with Chair Warsh maintaining higher-for-longer policy guidance despite June CPI moderation, sustaining real yields above 2.20% and DXY above 100 through H2 2026, triggering breakdown below $55.41 support toward $50.00 psychological level as remaining retail positioning forced to capitulate and sixth-year structural deficit narrative fails to provide floor against sustained monetary policy headwinds creating 10-12% additional downside cascade (Probability: medium)
Primary opportunity: Current $56.38 represents washed-out extreme after -54% decline from January $121.64 ATH with institutional positioning at mid-range post-washout creating asymmetric recovery potential if July 29 FOMC acknowledges June CPI moderation (-0.4% headline largest monthly decline since April 2020) enabling dovish signal weakening dollar below DXY 96 and driving real yields below 1.90%, allowing sixth-year structural deficit with 59% industrial demand and gold-silver ratio at 69.2:1 historical peak to reassert driving recovery toward $64-68 resistance as washed-out positioning provides upside fuel representing 14-21% recovery potential (Timeframe: 2-4 weeks post-July 29 FOMC through mid-August if Fed signals policy flexibility and inflation trajectory cooperates)
This week's edge: Market treating ninth consecutive BEARISH week and June 14 CPI moderation (-0.4% headline largest monthly decline since April 2020) as conflicting signals creating indecision, while desk recognizes June 14 dovish CPI surprise was empirically tested and failed to reverse trend as IndexBox.com documents temporary rally to $59.12 immediately reversed to current $56.38 breakdown validating monetary policy dominance thesis—ninth-week Bias Review threshold triggers mandatory re-justification confirming thesis remains valid (61% measured accuracy, +2.25R return validates approach) but July 29 FOMC 10 days away represents ultimate test where hawkish Warsh continuation extends breakdown toward $50-53 while dovish acknowledgment of CPI moderation reverses dollar weakness enabling sixth-year deficit with gold-silver ratio at 69.2:1 historical peak to drive 14-21% recovery creating binary setup where desk caps conviction at minimum 5 acknowledging two-way uncertainty consensus models underestimate
Volatility Backdrop
silver price is in a high-volatility environment (83th percentile over 90 days), where position sizing discipline becomes critical. Volatility remains anchored at current levels, with no clear signal of an imminent regime shift in either direction.
The Week Ahead
Federal Reserve July 28-29 FOMC meeting expected to hold rates at 3.50-3.75% with 95% probability per Polymarket, critical binary catalyst is whether Chair Kevin Warsh maintains hawkish stance from June 17 meeting (9-of-18 members projected potential hikes) or acknowledges June CPI moderation enabling dovish signal, statement and press conference 2:00 PM ET July 29 will determine whether dollar strength sustains above DXY 100 and real yields remain above 2.0% creating continued headwind or moderates allowing structural deficit fundamentals to reassert on Wednesday 29 July is a high-impact catalyst with the potential to redefine the near-term outlook entirely.
How silver navigates the confluence of breaking down conditions and incoming data will determine whether the current directional thesis holds or breaks.
This analysis covers one dimension. Our full weekly report combines six specialist agents into a single actionable briefing with directional bias, key levels, and risk-opportunity matrix.
Start Free — Get the Market of the WeekFree weekly report · No credit card · Upgrade anytime



