Silver Forecast This Week — Outlook, Drivers & Key Levels
This week's Silver outlook: key drivers, volatility context, risk-opportunity assessment and the week ahead.

This Week's Starting Point
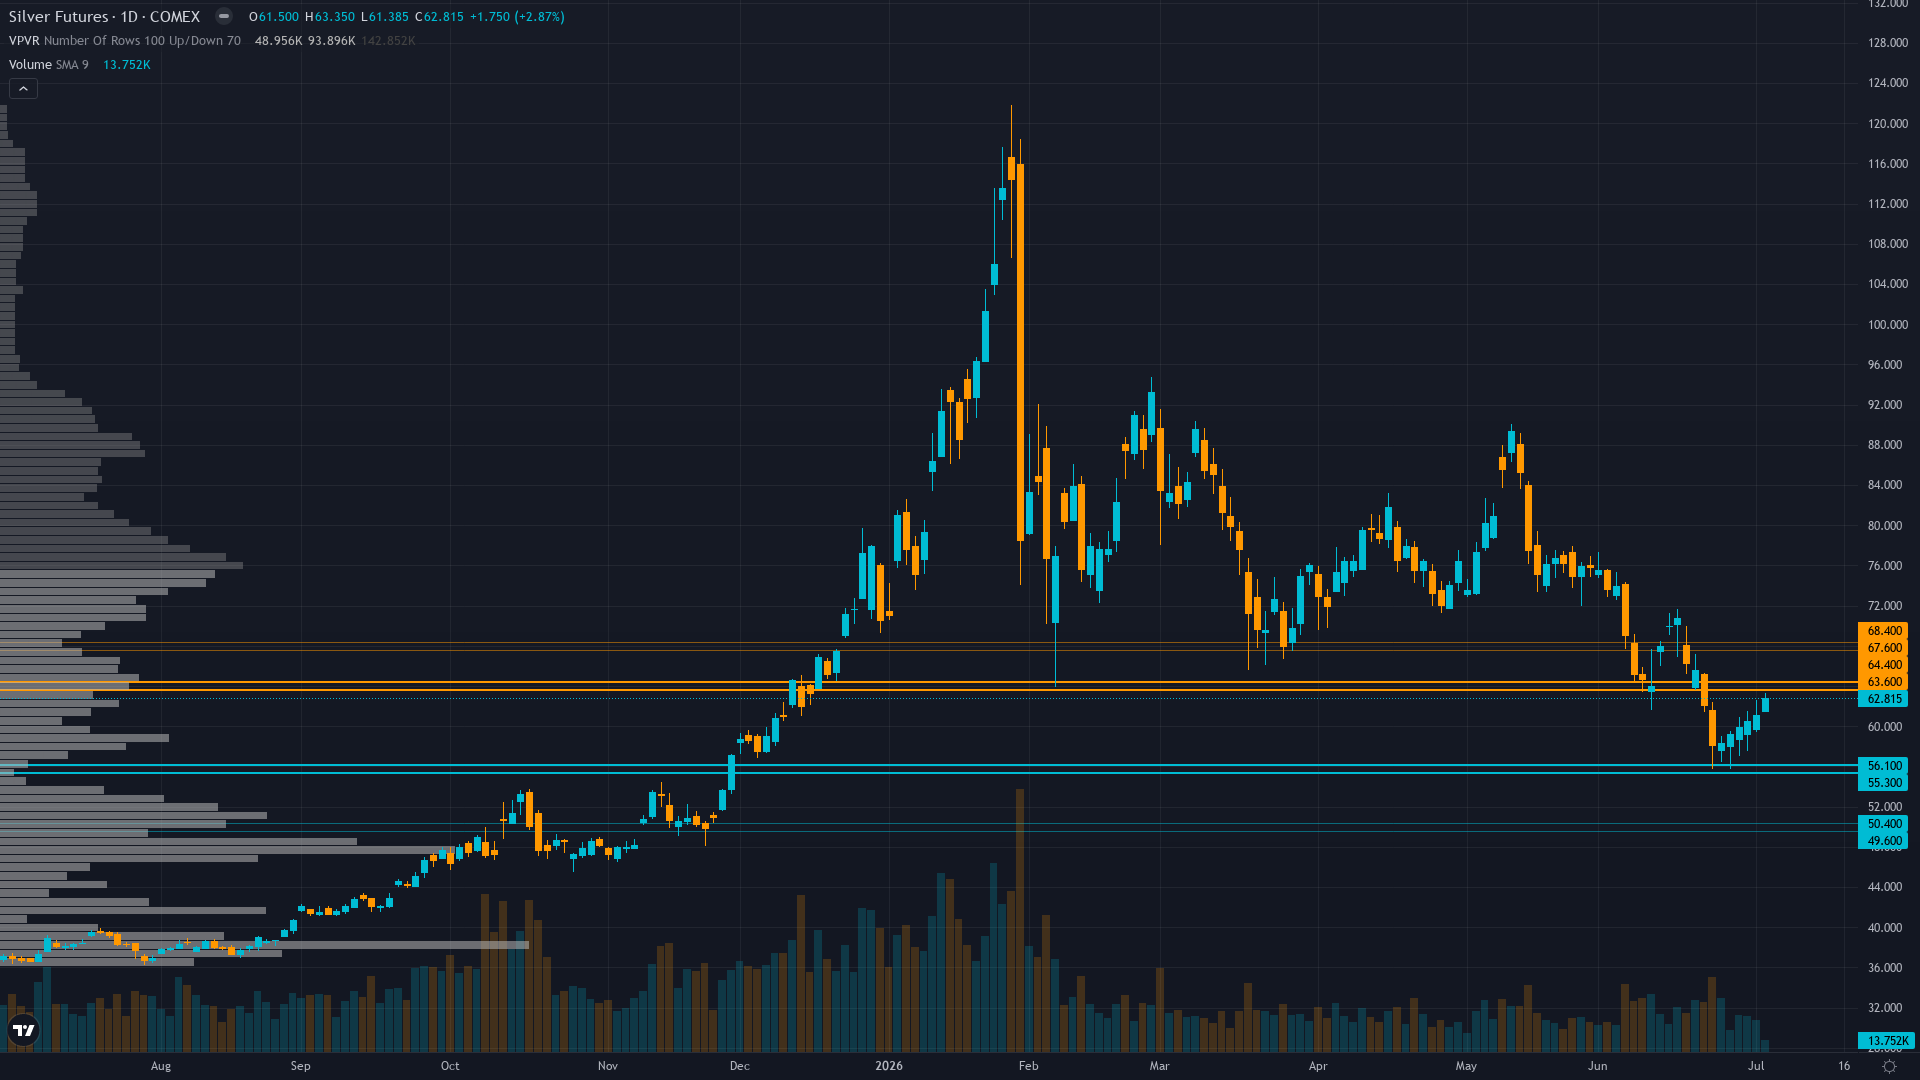
At 62.4, silver is unchanged — a pause that suggests the market is waiting for fresh direction. Price action in silver futures has compressed into a consolidation pattern, typically a precursor to a directional breakout.
Market consensus fractured between structural bulls targeting $68-75 recovery on intact sixth-year deficit fundamentals and cautious bears projecting $55-58 test if July 10 CPI hot, with CoinCodex algorithm predicting +5.33% to $65.62 by July 9 suggesting modest bullish algorithmic lean post-NFP bounce while DailyForex characterizes current position as failed rally with short sellers waiting to fade toward $50
Forces in Play
Primary driver: Last week's MISSED BEARISH call as silver rallied +6.14% from $59.18 to $62.81 following July 2 catastrophic NFP miss (+57K vs +110K consensus) creating temporary dollar weakness, but price now consolidating at $62.40 just 5 days ahead of July 10 binary CPI catalyst with stagflationary macro regime (weak labor + 4.2% inflation reacceleration) sustaining real yields above 2.0% creating mathematical headwind for non-yielding assets
Secondary factor: Sixth consecutive year of 67M oz structural deficit with 59% industrial demand fundamentally intact per Silver Institute April 15 report, but Reuters February 19 documentation of solar industry accelerating substitution away from silver at high price levels (threatens 196M oz = 17% of demand) introduces genuine demand elasticity headwind contradicting pure deficit thesis at $60+ levels
Additional influence: Extreme washed-out institutional positioning at 9,794 contracts (10-15th percentile of 3-year range) creates contrarian bullish setup where pain trade runs bullish on any rally forcing short covering, but requires Fed dovish catalyst at July 28-29 FOMC to reverse dollar strength below DXY 100 and drive real yields below 1.90% to enable recovery toward $68-72 resistance
Economic backdrop: Fed on hold at 3.50-3.75% after June 17 FOMC with market pricing 78% probability ZERO 2026 cuts reflecting higher-for-longer expectations, catastrophic June NFP miss at +57K vs +110K (July 2 release) shows labor market softening sharply while May CPI reaccelerated to 4.2% YoY creating stagflationary mix, 10Y Treasury at 4.49% sustaining real yields above 2.0% creating headwind for non-yielding silver, VIX 16.15 below 20 threshold indicates technical risk-on yet precious metals consolidating
Fundamental assessment: Sixth consecutive year of 67M oz structural deficit with 59% industrial demand unchanged per Silver Institute April 2026 report provides medium-term constructive floor above $58-61, but Reuters February 19 documentation of solar industry accelerating substitution at high prices (threatens 17% of demand) introduces demand destruction headwind that pure deficit models underestimate at $60+ levels
Technical Landscape
Consolidating at $62.40 after last week's +6.14% NFP-driven bounce from $59.18 low, trading below 50-day EMA resistance at ~$65.00 and well above 200-day MA at $64.15 support, RSI neutral-to-oversold offering no directional conviction, range-bound in $59-65 zone for 3 months following 44% collapse from January $121.64 ATH
Trend strength is low at 3/10, indicating weak directional conviction and potential for range-bound behaviour.
Risk-Reward Assessment
Primary risk: July 10 CPI shows inflation reacceleration above 4.0% forcing Fed to maintain restrictive stance through H2 2026 at July 28-29 FOMC, sustaining real yields above 2.0% and DXY above 100, triggering breakdown below $59 support toward $55.70 June low as stagflationary mix (weak labor + hot inflation) compounds monetary policy headwinds and solar demand substitution narrative (Reuters Feb 19 data showing 17% of demand threatened) validates demand destruction concerns (Probability: medium)
Primary opportunity: Current $62.40 level represents washed-out extreme after 44% decline from January $121.64 peak with institutional positioning at 10-15th percentile creating asymmetric recovery potential if July 10 CPI moderates below 3.5% enabling Fed dovish signal at July 28-29 FOMC weakening dollar below DXY 96 and allowing sixth-year structural deficit with 59% industrial demand to reassert driving recovery toward $68-72 resistance as short covering accelerates (Timeframe: 1-3 weeks through July 10 CPI and into late July if inflation data cooperates enabling Fed dovish tilt at July 28-29 FOMC)
This week's edge: Market treating July 2 NFP-driven bounce from $59.18 to $62.81 as validation of recovery trajectory, while desk recognizes this as technical relief within intact bearish structure requiring July 10 CPI catalyst to resolve direction—sixth-year deficit with 59% industrial demand creates fundamental floor above $55-58 that panic models underestimate, but desk also acknowledges Reuters February 19 fresh data showing solar substitution accelerating at high prices (threatens 17% of demand) introduces genuine demand elasticity headwind at $60+ levels that pure deficit bulls ignore, creating nuanced view where binary CPI risk 5 days away prevents high conviction and last week's MISSED call forces defensive low-conviction stance acknowledging two-way uncertainty
Risk Environment
With vol at the 83th percentile, silver price is trading in an elevated regime where daily ranges can surprise even experienced traders. Volatility is stable, with realised vol holding steady across timeframes. This equilibrium can persist but eventually resolves into expansion or contraction.
Looking Forward
All eyes turn to June CPI release at 8:30 AM EST on July 10, 2026 (5 days away) representing critical inflation data that will shape Fed July 28-29 FOMC expectations and dollar trajectory - hot reading above 4.0% reinforces higher-for-longer Fed stance sustaining real yields and dollar strength creating headwind for silver, cool reading below 3.5% enables Fed dovish shift weakening dollar and driving recovery on Friday 10 July, which carries enough weight to force a decisive directional move.
The week ahead for silver futures hinges on whether the prevailing consolidating regime can absorb the scheduled catalysts without a regime shift.
This analysis covers one dimension. Our full weekly report combines six specialist agents into a single actionable briefing with directional bias, key levels, and risk-opportunity matrix.
Start Free — Get the Market of the WeekFree weekly report · No credit card · Upgrade anytime



