Russell 2000 Key Levels This Week — Support, Resistance & Confluence Zones
Russell 2000 key levels breakdown: support zones, resistance zones, confluence and price structure.

Structural Assessment
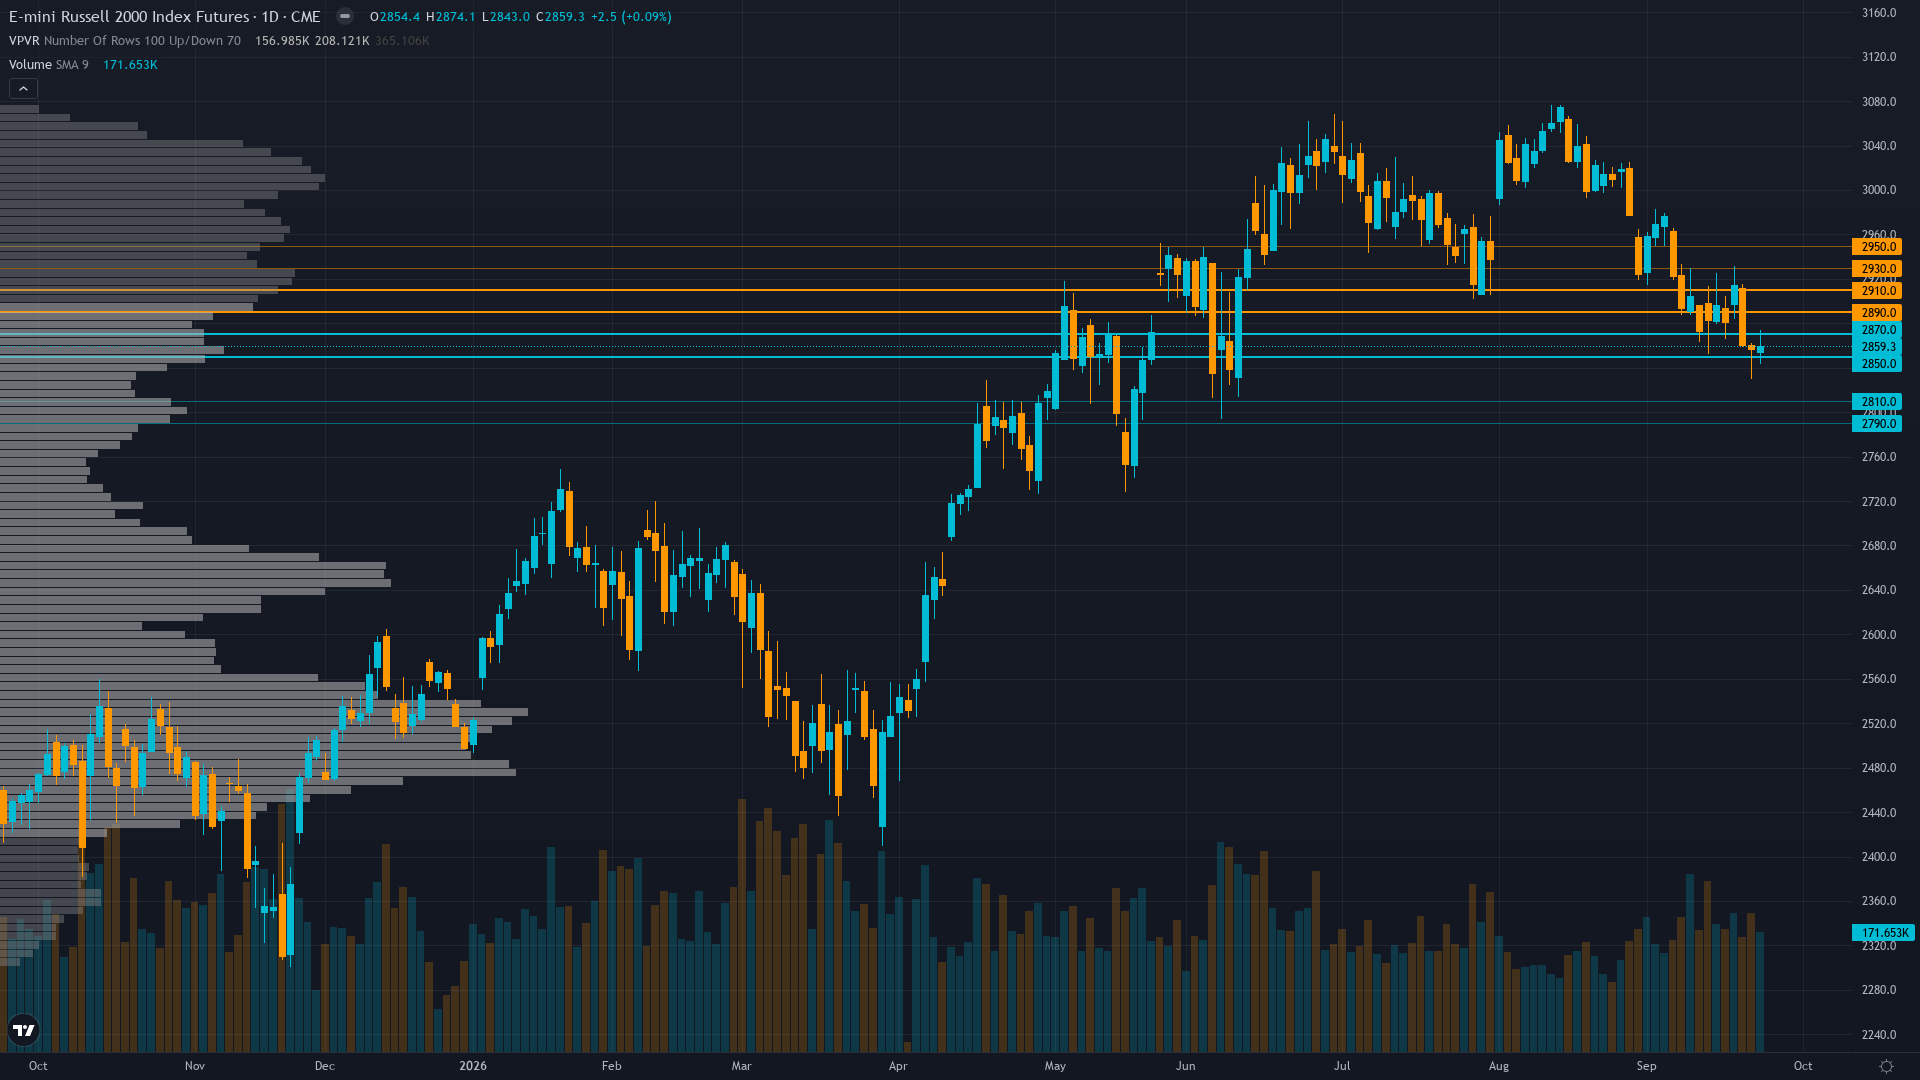
Trading at 2859.3 with a 0.28% dip, Russell 2000 is giving back ground gradually. Russell 2000 futures is in a breaking down market state, requiring careful assessment of current conditions.
Confirmed bearish downtrend with price at 2859.3 trading decisively below both the 50-day MA (~2900) and 200-day MA (~2825), RSI at ~34 in oversold territory but without bullish divergence, MACD negative confirming bearish momentum, having broken below 2900 psychological support — the index has printed lower highs and lower lows since the Aug 14 ATH at 3074.9, now -7.0% from that peak and -11.4% from the June 25 record, with the 200-day MA at 2825 as the final support before a potential move toward 2750 major support
At 7/10, trend strength indicates a solid directional lean without being overextended.
Support Architecture
Support levels for Russell 2000 are defined by zones of prior institutional demand. The depth and frequency of prior tests at these levels determines their likely strength.
The strength of support depends on the current trending down regime and volume profile at each level.
Upside Barriers
Resistance levels above small-cap futures current price represent zones of historical supply. The significance of each level scales with the number of prior tests and the volume traded there.
The current breaking down regime influences how aggressively these resistance zones are likely to be tested and whether they hold or fold.
Confluence & Methodology
Confluence is the differentiator between a line on a chart and a level worth trading. For Russell 2000 futures, the zones with the highest conviction are those validated across technical, institutional, and derivatives dimensions simultaneously.
Normal volatility regime at 62nd percentile supports standard risk management with stop placement near 2,800 below 200-day MA support, expect 40-65 point daily ranges expanding to 65-85 on Sep 29 catalyst day, the stable vol structure and extreme net short positioning signal building tension that could resolve with a sharp directional move on the Sep 29 data cluster — range-trading between 2,825-2,900 with defined boundaries preferred until JOLTs and Consumer Confidence data provide directional clarity, though the breakdown structure favors bearish positioning with tight stops
Beyond Lines on a Chart
Our approach to key levels is designed to filter noise from signal. Six independent agents each assess the same price zones from different perspectives. A level confirmed by one discipline is interesting. A level confirmed by four or five is worth building a trade plan around.
This multi-discipline approach means the levels in our paid reports carry institutional-grade confluence — not just lines on a chart, but zones validated across every analytical dimension that matters.
Our paid reports include specific support and resistance levels identified by six specialist agents — technical structure, institutional positioning, options flow, fundamentals, sentiment, and economic analysis. Not just lines on a chart, but zones validated by multi-discipline confluence.
Start Free — Get the Market of the WeekFree weekly report · No credit card · Upgrade anytime


