Russell 2000 Key Levels This Week — Support, Resistance & Confluence Zones
Russell 2000 key levels breakdown: support zones, resistance zones, confluence and price structure.

Price Architecture
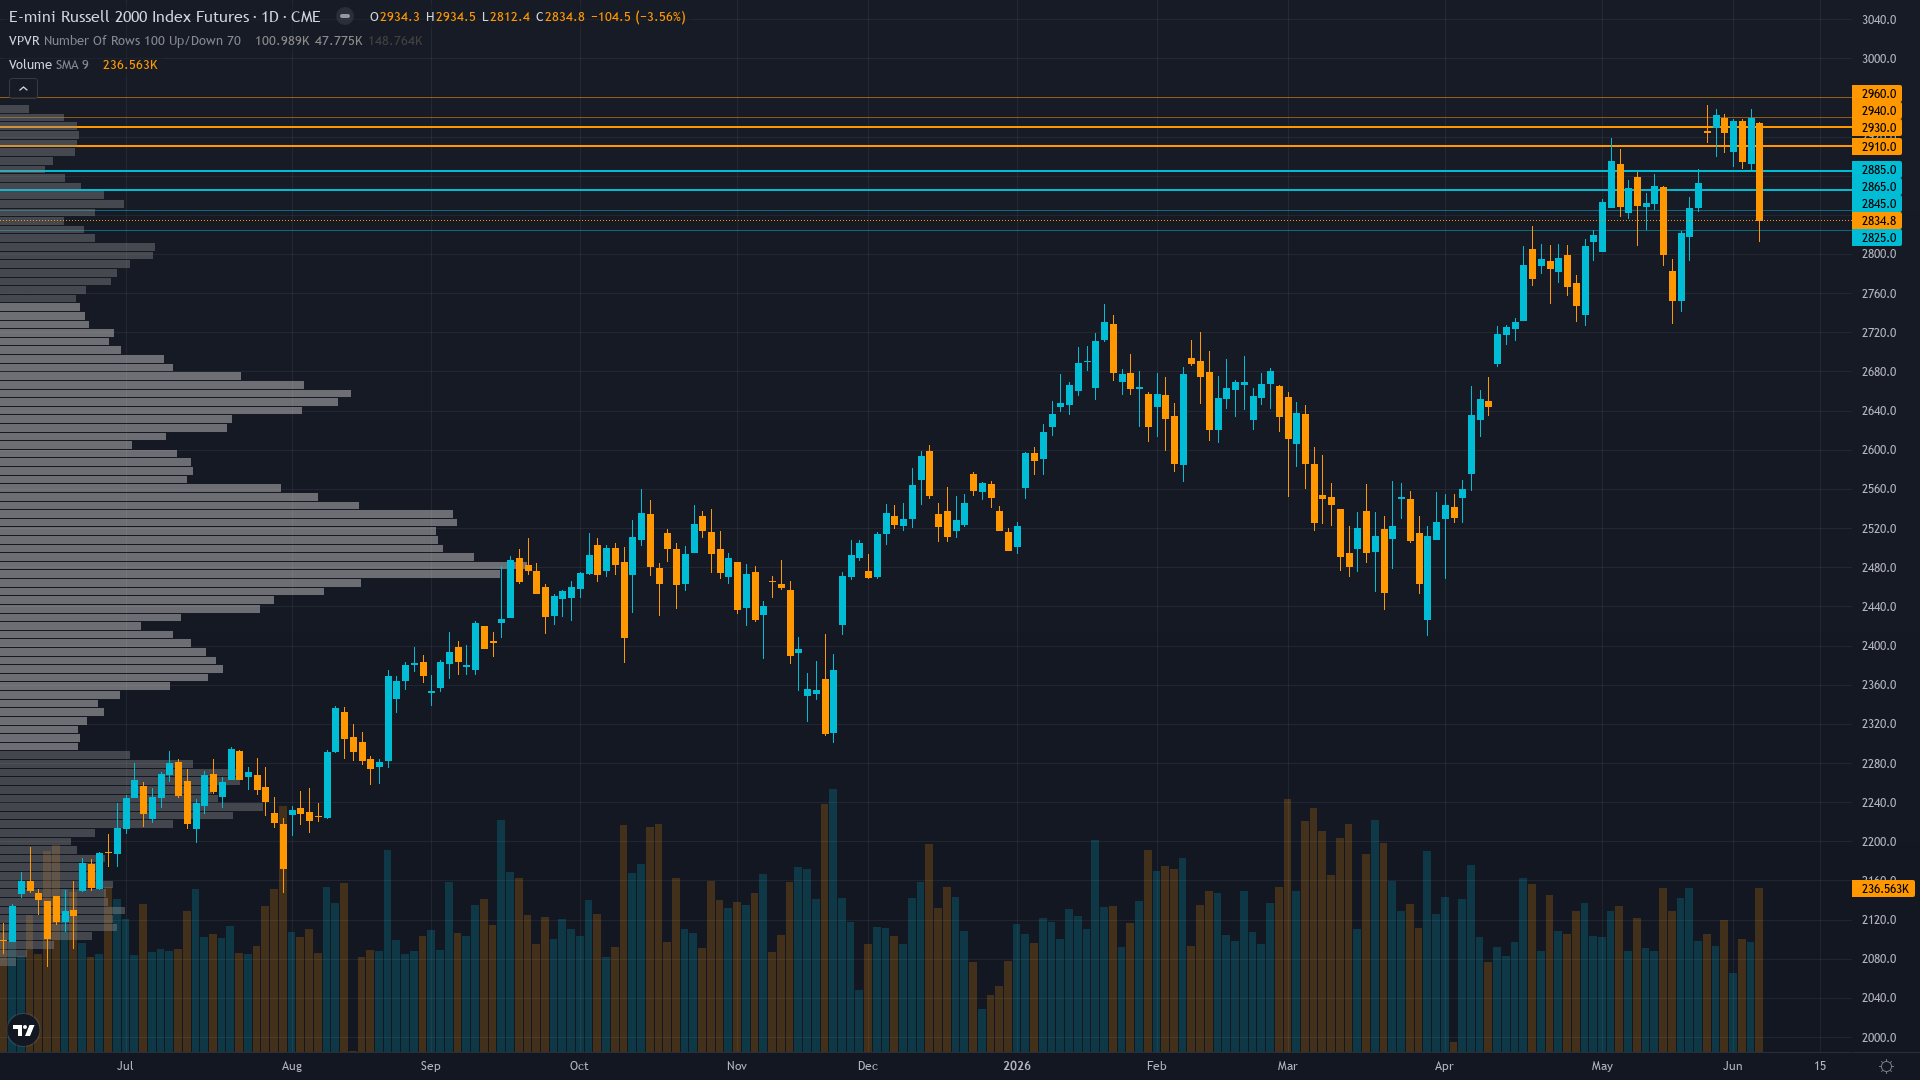
Trading at 2921.5 with a 0.15% dip, Russell 2000 is giving back ground gradually. The market in Russell 2000 futures is coiling, with narrowing price ranges suggesting stored energy that will eventually release.
Price at 2921 consolidating 0.9% below May 27 ATH of 2947, RSI 33.73 oversold but no bullish divergence yet, trading range 2900-2935 reflects indecision
Trend strength sits at 4/10, reflecting moderate directional pressure without clear dominance.
Downside Protection
The downside architecture for Russell index features support zones rooted in prior buying activity. These are not arbitrary lines but areas where real capital has previously been committed.
The reliability of support under consolidating conditions is shaped by the interplay between volatility regime and historical volume at each level.
Resistance Zone Context
The upside path for RTY futures is marked by resistance zones where prior selling activity created structural barriers. Clearing these zones requires either strong momentum or a shift in the fundamental picture.
In the current market state, resistance zones remain key decision points.
Analytical Convergence
The most actionable levels for Russell 2000 are those where multiple analytical disciplines converge. When technical structure, institutional positioning, and options flow all point to the same zone, the probability of price reacting there increases meaningfully.
Normal volatility regime at 45th percentile supports standard risk management with 2-3% stops below 2800 support, expect 30-50 point daily ranges versus 60-100 during elevated volatility periods, stable pattern suggests consolidation environment until June FOMC or reconstitution catalyst provides directional clarity
Our Multi-Agent Approach to Key Levels
The levels in our paid reports are generated by six specialist agents working in parallel. Technical analysis provides the structural framework, institutional data shows where capital is committed, options flow reveals hedging behaviour, fundamentals anchor levels to value, sentiment gauges crowd positioning, and economic analysis times the catalysts.
The output is a curated set of levels with institutional-grade validation — the kind of multi-dimensional analysis that hedge fund research desks produce, delivered at a fraction of the cost.
Our paid reports include specific support and resistance levels identified by six specialist agents — technical structure, institutional positioning, options flow, fundamentals, sentiment, and economic analysis. Not just lines on a chart, but zones validated by multi-discipline confluence.
Start Free — Get the Market of the WeekFree weekly report · No credit card · Upgrade anytime