Russell 2000 Forecast This Week — Outlook, Drivers & Key Levels
This week's Russell 2000 outlook: key drivers, volatility context, risk-opportunity assessment and the week ahead.

This Week's Starting Point
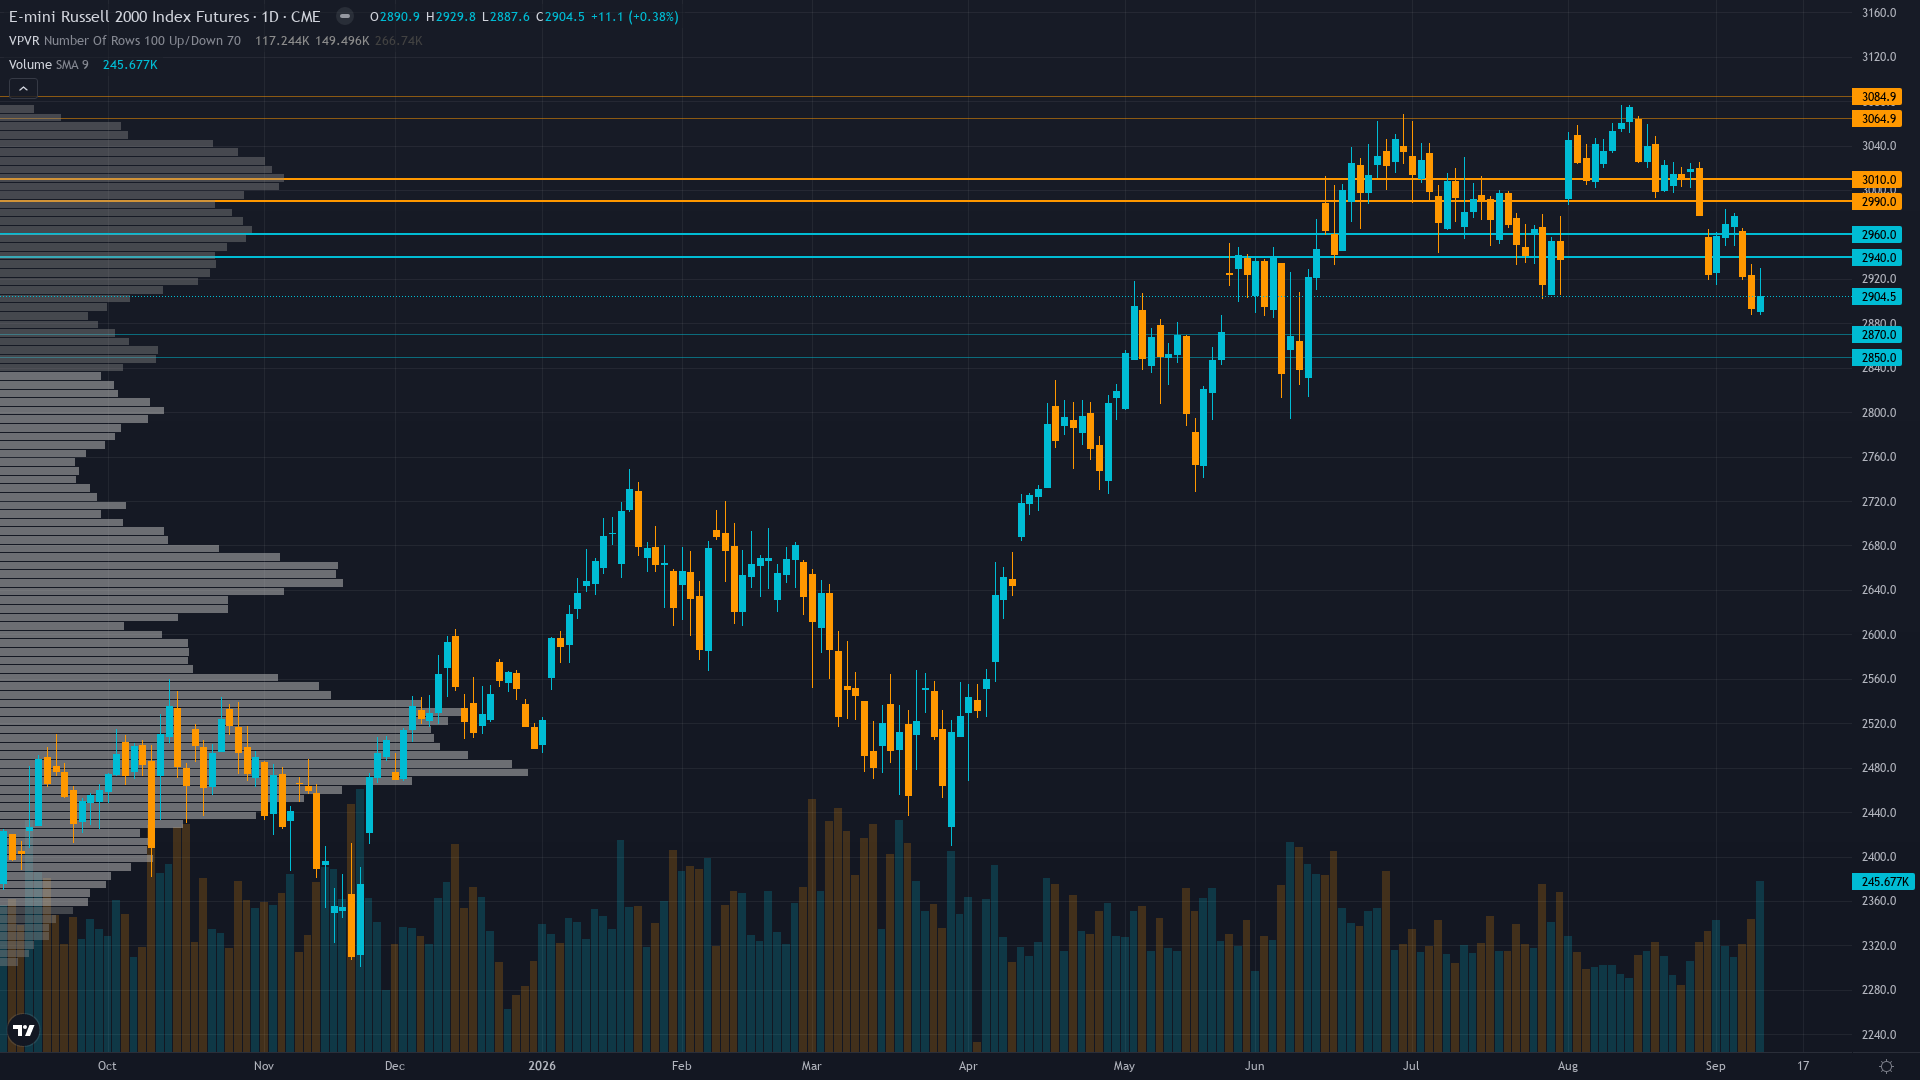
Russell 2000 holds at 2904.5, up a marginal 0.38% as the market grinds forward. Price action in Russell 2000 futures has compressed into a consolidation pattern, typically a precursor to a directional breakout.
Small-caps in an accelerating downtrend after breaking below August consolidation support, with market pricing rising rates and FOMC hawkish risk into September seasonal headwinds, while extreme speculative short positioning at 1.9th percentile creates latent squeeze risk that has not yet materialized
Forces in Play
Primary driver: COT speculative net short positioned at -82,835 contracts (1.9th percentile of 3-year range, -19.2% of OI) — the most extreme bearish positioning in over 3 years, having added -11,172 contracts of short exposure even as the index has already corrected -5.5% from the Aug 14 ATH at 3,074.9, creating an unprecedented squeeze setup ahead of the Sept 16 FOMC Economic Projections binary catalyst
Secondary factor: Technical downtrend structure with RTY at 2,904.5 decisively below the 2,960-3,000 breakdown zone, RSI at 33.7 oversold but momentum confirms the bearish structure, having now fallen -5.5% from the Aug 14 ATH and -8.6% from the June 25 peak, with 10Y Treasury yield surging 18bp in one week to 4.96% creating acute headwinds for floating-rate-debt-heavy small-cap balance sheets
Additional influence: FOMC Economic Projections and dot plot release on Sept 16 at 18:00 UTC represent the dominant binary catalyst — the June 17 FOMC showed 9 of 18 officials pencilling a potential 2026 rate hike, and the updated projections will either confirm that hawkish trajectory (bearish for credit-sensitive RTY) or moderate it, with Retail Sales MoM (Aug) released earlier that day at 12:30 UTC (consensus 0.9% vs prior -0.6%) providing the coincident data context for the Fed's economic assessment
Economic backdrop: TRANSITIONAL leaning RISK-OFF: Fed funds at 3.63% with FOMC projections due Sept 16, inflation at 2.36% near target but 10Y yield surging 18bp in one week to 4.96%, 2s10s curve steepened to +33bp reflecting tightening expectations, unemployment stable at 4.1%, smoothed recession probability at 0.76% — the macro backdrop shows rising rate pressure that disproportionately impacts credit-sensitive small-cap constituents carrying floating-rate debt
Fundamental assessment: Forward P/E of approximately 19.9x represents a 34% discount to the Russell 1000's 29.3x valuation, with consensus projecting 43% YoY earnings growth for 2026, but the domestic-demand sensitivity of small-caps makes them acutely vulnerable to the rising rate environment and any economic slowdown signal from the Sept 16 Retail Sales data
Technical Landscape
Price at 2,904.5 trading in a confirmed downtrend below the 50-day and 200-day moving averages, having broken below the 2,960-3,000 support zone that held through August, with RSI at 33.7 oversold but showing no bullish divergence, and the corrective structure showing lower highs and lower lows since the Aug 14 ATH break
Trend strength is low at 3/10, indicating weak directional conviction and potential for range-bound behaviour.
Risk-Reward Assessment
Primary risk: FOMC Economic Projections on Sept 16 confirm or intensify the hawkish trajectory from the June 17 dot plot (9 of 18 officials expecting 2026 rate hike), triggering a breakdown below 2,860 support toward 2,750-2,800 as credit-sensitive small-cap constituents reprice tightening financial conditions into a weakening domestic growth backdrop, amplified by September seasonal headwinds that historically produce negative average returns for RTY (Probability: medium)
Primary opportunity: The extreme speculative net short at -82,835 contracts (1.9th percentile) creates asymmetric squeeze potential if the Sept 16 FOMC projections and Retail Sales data provide a benign outcome — a dovish lean in the dot plot or strong retail sales surprising consensus would force a violent short-covering rally from the most extreme bearish positioning in 3+ years, targeting a retest of 2,940-3,000 resistance, amplified by RSI 33.7 oversold conditions and the 34% valuation discount to large caps (Timeframe: 1-2 weeks through Sept 16 FOMC catalyst resolution)
This week's edge: Thesis health degraded — conviction insufficient for directional call. The extreme net short positioning at -82,835 contracts (1.9th percentile of 3-year range) is one of the most powerful contrarian signals in the data history and represents a genuine blindspot that consensus bearish positioning has not priced — the market is aggressively short an index that has already corrected -5.5% from ATH with RSI oversold at 33.7 and a 34% valuation discount to large caps. However, this squeeze setup is offset by rising 10Y yields (4.96%, +18bp in 1W), confirmed technical breakdown below 2,960 support, and two consecutive BULLISH MISSED calls that have degraded the thesis health below actionable conviction. The binary FOMC catalyst on Sept 16 will resolve this tension — a dovish projection forces shorts to cover violently; a hawkish confirmation accelerates the selloff toward 2,750-2,800. The desk is NEUTRAL until the catalyst resolves, unable to confidently pre-position despite the historically extreme contrarian setup.
Risk Environment
With vol at the 62th percentile over 90 days, RTY futures is in a measured regime that doesn't require unusual adjustments. Volatility is stable, with realised vol holding steady across timeframes. This equilibrium can persist but eventually resolves into expansion or contraction.
Normal volatility regime at 62nd percentile with inverted term structure requires wider stop placement near 2,860 immediate support, expect 50-80 point daily ranges expanding to 80-100 on Sept 16 FOMC/Retail Sales day, the inverted term structure and record extreme net short positioning signal binary catalyst outcome that makes pre-positioning unreliable but creates asymmetric opportunity for a short-covering squeeze on benign data
Seasonal Context
Historically, September 2026 has been a headwind for small-cap futures, with seasonal data showing a 40% win rate. September is historically weakest month.
Week Ahead Outlook
The next major catalyst is Retail Sales MoM (Aug) at 12:30 UTC — consensus 0.9% vs prior -0.6%, followed by FOMC Economic Projections at 18:00 UTC, constituting the most important dual catalyst week for small-cap directionality since the Aug 14 ATH reversal on Wednesday 16 September — a high-impact event that could materially shift the directional picture.
For Russell 2000, the balance between existing momentum and scheduled risk events sets the stage for the week ahead.
This analysis covers one dimension. Our full weekly report combines six specialist agents into a single actionable briefing with directional bias, key levels, and risk-opportunity matrix.
Start Free — Get the Market of the WeekFree weekly report · No credit card · Upgrade anytime


