Russell 2000 Forecast This Week — Outlook, Drivers & Key Levels
This week's Russell 2000 outlook: key drivers, volatility context, risk-opportunity assessment and the week ahead.

This Week's Starting Point
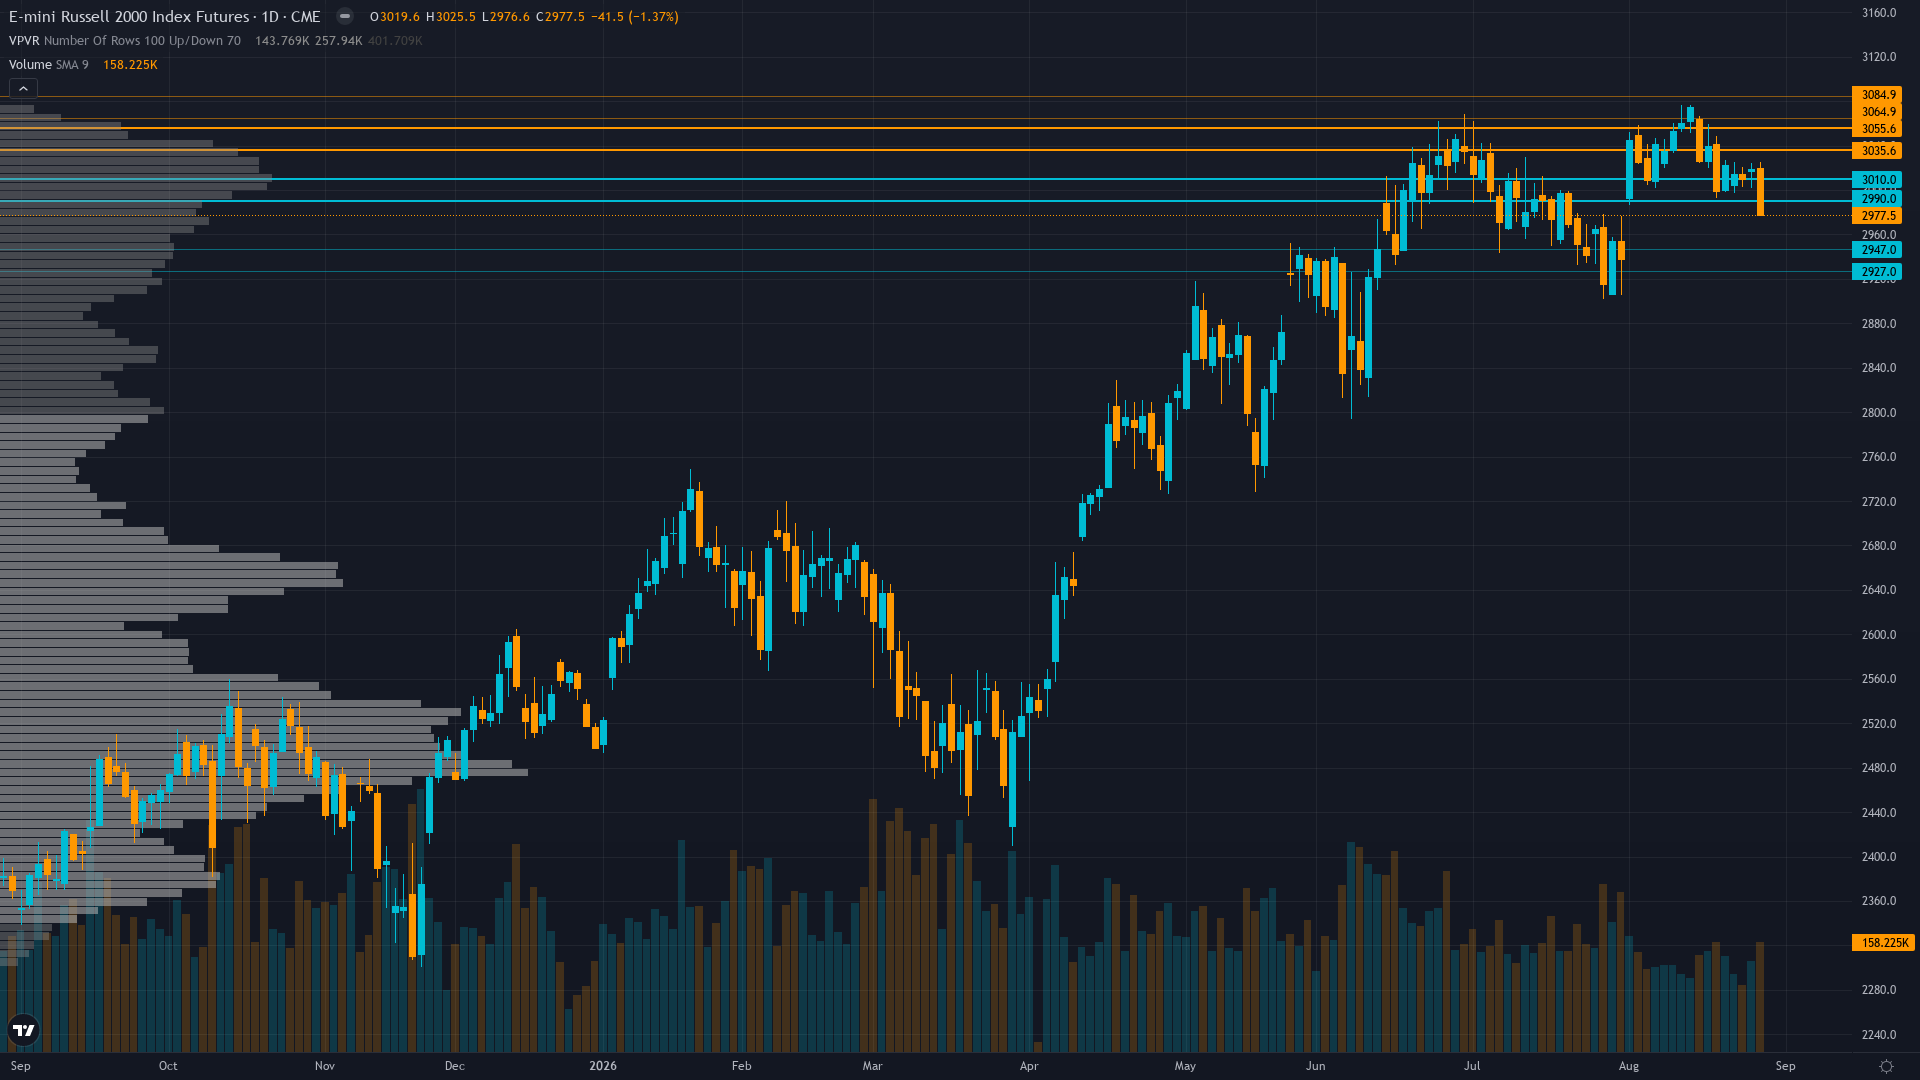
Russell 2000 holds at 3018.9, off 0.14% in a modest retracement from recent levels. Price action in Russell 2000 futures has compressed into a consolidation pattern, typically a precursor to a directional breakout.
Small-caps in consolidation after Jackson Hole hawkish surprise with market pricing potential rate hike by year-end, awaiting ISM/ADP data this week for economic trajectory clarity
Bull & Bear Case
Primary risk: Hawkish Fed repricing accelerates following Warsh's Jackson Hole speech, with markets pricing a 25bp rate hike by October or December, triggering a 5-8% correction in RTY toward 2,800-2,860 support as credit-sensitive small-caps carrying floating-rate debt reprice tightening financial conditions into a domestic growth environment showing mixed signals, amplified by extreme speculative net short positioning that could drive aggressive covering on the downside (Probability: high)
Primary opportunity: Oversold bounce from the Jackson Hole selloff as the market prices a rate hike that is still months away (Oct-Dec), combined with extreme speculative net short positioning (-51,578 contracts, 24.1st percentile) creating short-covering squeeze potential if ISM Manufacturing or ADP data this week surprises to the upside, with RSI oversold conditions and the 50-day MA near 3,002 providing technical anchor for a retest of 3,045-3,075 resistance (Timeframe: 1-2 weeks through Sep 1-2 ISM/ADP data catalysts)
This week's edge: Below noise threshold — range-bound assessment. The extreme speculative net short positioning (-51,578 contracts, 24.1st percentile) combined with oversold RSI creates genuine squeeze potential that may be underappreciated by a market focused on hawkish Fed rhetoric, but the Jackson Hole catalyst is too fresh and too directionally aligned with RTY's structural vulnerability to credit conditions to fade with conviction — the desk sees a tense balance where neither directional bet has a probabilistic edge until ISM data on Sep 1 provides catalyst resolution
This Week's Catalysts & Drivers
Primary driver: Fed Chair Warsh's Jackson Hole speech on August 28 opened the door to a potential rate hike (Oct-Dec timeframe), explicitly warning inflation remains too high at 2.31%, creating acute headwinds for credit-sensitive small-caps carrying floating-rate debt exposure — RTY dropped 1.39% on the speech day with RUT falling to 2,972.37, but has since recovered modestly to ~3,019 in Sunday pre-market
Secondary factor: Extreme speculative net short positioning at -51,578 contracts as of Aug 25 (24.1st percentile of 3-year range, -12.5% of OI) with a -9,363 contract bearish adjustment week-over-week — specs are adding shorts into a market that has already pulled back 3.1% from the Aug 14 ATH at 3,074.9, amplifying squeeze potential if rate fears prove overdone but also representing informed selling into weakness
Additional influence: September-October seasonal headwinds intensify as the Russell 2000 historically loses value during these months per CBOE research, while the ISM Manufacturing PMI (Sep 1) and ADP Employment (Sep 2) provide the first major data tests of whether the economy can sustain the current growth trajectory without forcing the Fed's hand
Economic backdrop: TRANSITIONAL shifting toward RISK-OFF: Fed Chair Warsh's Jackson Hole speech explicitly warned inflation is too high and opened the door to rate hikes (Oct-Dec), VIX still below 20 at 14.44 signals complacency, 10Y yields at 4.73% with the 2s10s curve steep at 39bp reflecting tightening expectations, inflation at 2.31% above the 2% target, and labor market at 4.1% unemployment still historically tight — the macro environment is transitioning from benign risk-on to a rate-wary posture
Fundamental assessment: Forward P/E of ~19.2x represents a 34.5% discount to large caps (Russell 1000 at 29.3x), providing relative value support, but the absolute valuation premium to the 20-year average of 16.2x and the hawkish Fed pivot create headwinds for the domestic-demand-driven small-cap earnings trajectory
Technical Picture
Price at 3,019 is consolidating below the 50-day MA (~3,002 after the recent pullback), having broken the 3,000 psychological support intraweek on Aug 28 before recovering, with RSI around 33-35 oversold on the daily timeframe and the rising 50-day MA acting as dynamic support near 3,002 per OneUp Trader analysis
At 3/10, trend strength is subdued, suggesting the market lacks a clear directional mandate.
Risk Environment
With vol at the 62th percentile over 90 days, RTY futures is in a measured regime that doesn't require unusual adjustments. Volatility is stable, with realised vol holding steady across timeframes. This equilibrium can persist but eventually resolves into expansion or contraction.
Normal volatility regime at 62nd percentile with inverted term structure requires wider stop placement near 2,937 major support, expect 40-60 point daily ranges expanding to 60-80 on ISM/ADP data days, the inverted term structure signals near-term catalyst risk that makes directional pre-positioning unreliable until ISM provides clarity — range-trading between 3,000-3,045 with defined boundaries preferred
Seasonal Context
Historical seasonal patterns for small-cap futures offer no strong directional signal in August 2026 (48% win rate). Late summer low volume, high volatility risk.
Week Ahead Outlook
The next major catalyst is ISM Manufacturing PMI (Aug) — consensus 55.3 vs prior 55.6, with ISM Manufacturing Employment at 52.5 vs 52.8 — critical test of whether manufacturing strength can persist despite rising rate expectations on Tuesday 1 September — a high-impact event that could materially shift the directional picture.
For Russell 2000, the balance between existing momentum and scheduled risk events sets the stage for the week ahead.
This analysis covers one dimension. Our full weekly report combines six specialist agents into a single actionable briefing with directional bias, key levels, and risk-opportunity matrix.
Start Free — Get the Market of the WeekFree weekly report · No credit card · Upgrade anytime