Copper COT & Institutional Positioning — Smart Money Analysis
Copper institutional positioning: COT data, sentiment analysis and smart money flow assessment.

Where Institutions Stand
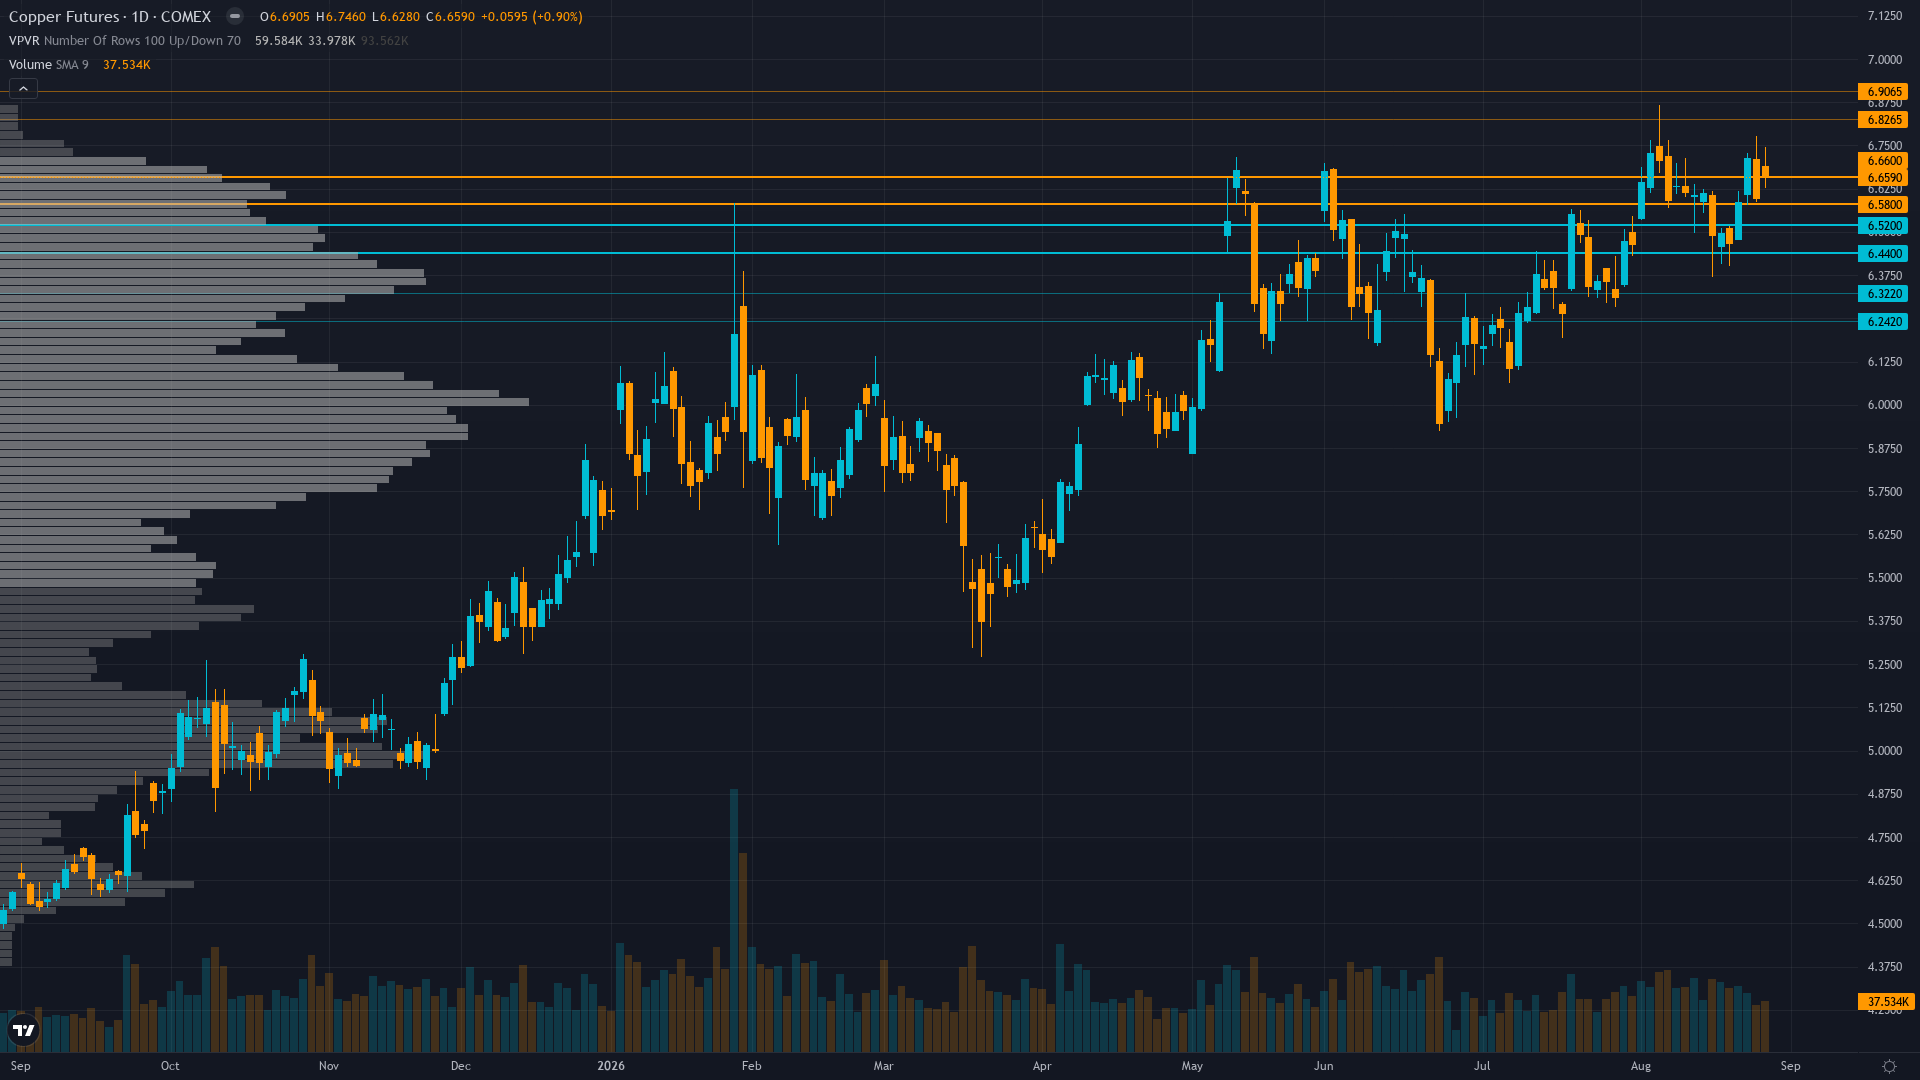
copper holds at 6.562, off 0.90% in a modest retracement from recent levels.
Non-commercial net long at 85,266 contracts as of Aug 25, at 99.4th percentile of 3-year range representing extreme bullish speculative crowding with +5,518 WoW increase, creating acute contrarian mean reversion risk if demand catalysts disappoint
Consensus vs MAD View
Market consensus: Copper consolidating near 52-week highs supported by structural supply deficit and AI demand themes but extreme speculative positioning at 99.4th percentile COT and fresh LME inventory build of 63,000 tonnes creating tactical uncertainty ahead of China PMI catalyst on Aug 31
Primary driver: Extreme institutional positioning at 99.4th percentile COT (85,266 net long contracts) conflicts with improving Chinese demand expectations ahead of Aug 31 NBS Manufacturing PMI, creating analytical paralysis that prevents directional conviction
Where the Crowd May Be Wrong
Low divergence: the desk's NEUTRAL stance aligns with market's own consolidation uncertainty ahead of Aug 31 China PMI, as both await catalyst resolution of the tension between extreme COT positioning and physical easing from the 63,000-tonne LME inventory build
Crowd Psychology
Neither side has committed heavily to copper futures, leaving sentiment in a neutral zone that offers little directional guidance on its own.
Options Flow
Options data limited and dated (Aug 3) showing IV at 28.7% vs realised vol of 16.6%, put/call volume ratio of 0.43 suggesting call bias but insufficient to draw actionable directional conclusions from stale data
The Bottom Line on Positioning
The positioning mosaic for HG futures combines neutral sentiment with contracting volatility conditions. Trend strength registers at 6/10, suggesting meaningful but not extreme directional bias. Taken together, institutional behaviour, crowd psychology, and derivatives data frame the setup heading into the new week.
This analysis covers one dimension. Our full weekly report combines six specialist agents into a single actionable briefing with directional bias, key levels, and risk-opportunity matrix.
Start Free — Get the Market of the WeekFree weekly report · No credit card · Upgrade anytime