Nasdaq 100 Forecast This Week — Outlook, Drivers & Key Levels
This week's Nasdaq 100 outlook: key drivers, volatility context, risk-opportunity assessment and the week ahead.

Current Market Picture
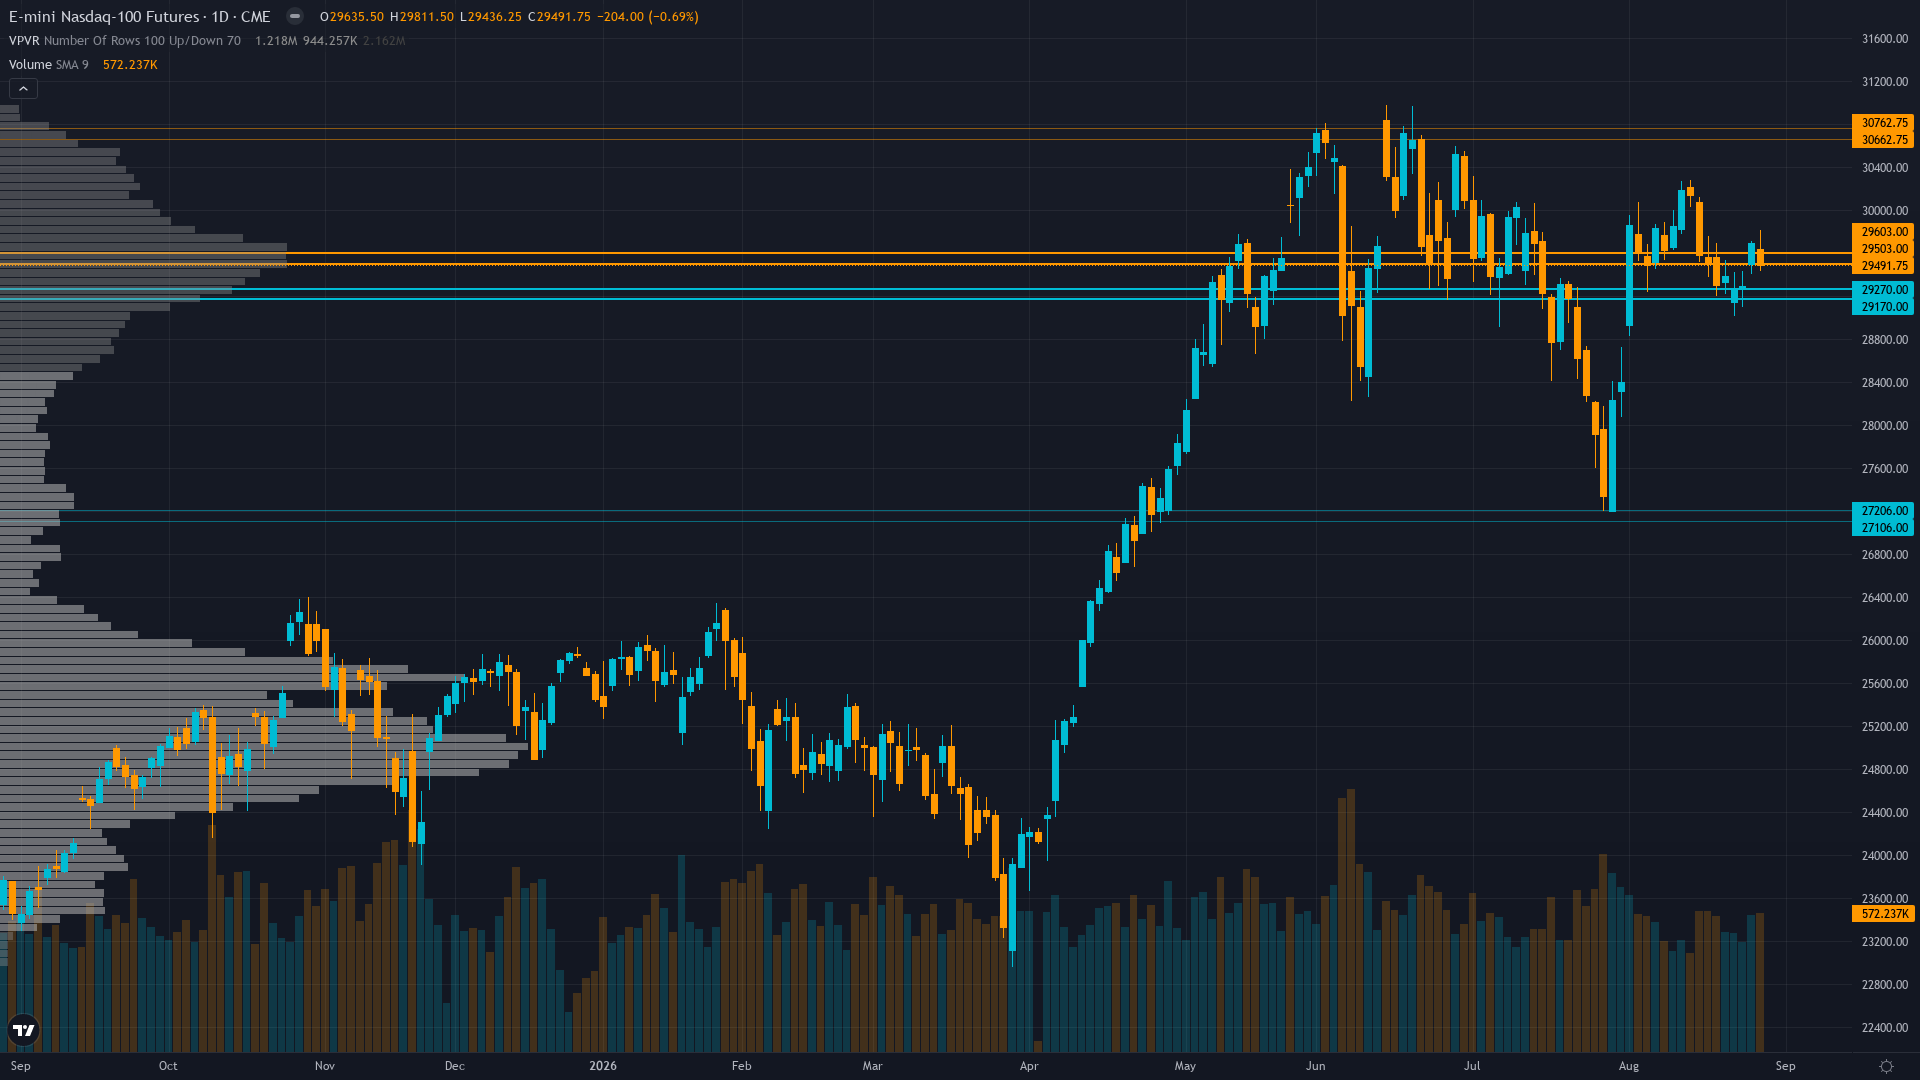
Nasdaq 100 sits at 29491.75 after slipping 0.69% — a shallow pullback rather than a decisive move. The market in Nasdaq 100 futures is coiling, with narrowing price ranges suggesting stored energy that will eventually release.
Constructive but cautious after Nvidia earnings validated AI thesis, with consensus acknowledging improved institutional positioning and contained macro backdrop while noting September seasonal weakness and 30,000 resistance as headwinds preventing aggressive bullish positioning
Key Drivers This Week
Primary driver: Synthesized signal at 0.94 falls just below the 1.0 Min Signal threshold per Rule 2, mandating NO CALL despite constructive confluence across Economic, Institutional, and Technical disciplines following Nvidia's Aug 26 earnings beat validating AI capex thesis
Secondary factor: CFTC COT data from Aug 25 shows non-commercials added +20,455 net long contracts to +10,039 net long (36.7th percentile), representing significant bullish momentum after earlier extreme short positioning was covered, reducing squeeze potential but confirming trend-following institutional flows
Additional influence: September seasonality represents a material headwind with Nasdaq-100 historically averaging -0.6% in September, as flagged by Motley Fool Aug 28 analysis, creating a calendar-based risk layer that partially offsets the constructive macro backdrop and will be a dominant narrative entering Tuesday's open
Economic backdrop: RISK-ON macro regime: Fed on hold at 3.63% with 55% probability of no change in September, CPI contained at 2.31%, unemployment at 4.1%, recession probability at 0.6%; 10Y yield at 4.73% (down 1bp weekly) and 30Y at 5.22% (down 5bp) providing slight relief for duration-sensitive tech; ISM Manufacturing PMI due Sep 1 with estimate 55.3 vs prior 55.6 is the next high-impact catalyst
Fundamental assessment: Nasdaq 100 forward P/E at 22.4x slightly below historical average of 28.97x, representing reasonable valuation supported by 75.1% Q2 2026 blended earnings growth and $725B AI infrastructure spending commitment; Nvidia's Aug 26 earnings validated the AI thesis with revenue guidance beat, removing a major uncertainty factor
Price Structure
Consolidating at 29,492 after bouncing from EMA ribbon support at 29,280-29,435 (Aug 27), still decisively below the 50-day moving average near 29,673 and the psychological 30,000 resistance, with measured upside target of 30,327 per OneUp Trader but no breakout catalyst to drive through resistance
Trend strength at 4/10 paints a picture of a market with some direction but lacking strong conviction.
Upside & Downside
Primary risk: September seasonal weakness (-0.6% average for Nasdaq-100) combining with consolidation beneath 30,000 resistance creates breakdown risk: if ISM Manufacturing disappoints on Sep 1, NQ could break below 29,150 EMA support toward 28,400 major support, amplified by post-Labor Day volume normalization and potential institutional rebalancing (Probability: medium)
Primary opportunity: Institutional positioning tailwind — non-commercials added +20,455 net long contracts in the latest COT week (Aug 25), confirming trend-following accumulation; combined with residual hedge fund short exposure ($16-20B), quarter-end window dressing approaching September 30 could drive institutional flows into mega-cap tech, targeting measured move above 30,000 toward 30,327 (Timeframe: 2-4 weeks as September seasonal drag initially weighs but quarter-end rebalancing flows into mega-cap tech in the final two weeks of September provide mechanical support for a push toward 30,000+ resistance; ISM Manufacturing (Sep 1), JOLTs (Sep 1), and ADP Employment (Sep 2) provide the first directional tests)
This week's edge: Signal at 0.94 falls just below 1.0 Min Signal threshold — no directional call this week despite constructive confluence across Institutional (COT +20,455 net long addition, 36.7th percentile), Economic (RISK-ON regime, Fed on hold, contained inflation), and Technical (EMA ribbon bounce with measured 30,327 target), offset by September seasonal headwind, convergence of positioning with price reducing asymmetric upside, and persistent 30,000 resistance; the market may be underweighting the magnitude of the COT positioning shift (+20,455 contracts in a single week representing a complete flip from net short to net long) as a structural tailwind for September, but the seasonal drag is equally real and the desk lacks conviction to pick between these opposing forces
Volatility Context
At the 42th percentile, NQ futures volatility sits in a normal range, neither compressed enough to signal a breakout nor elevated enough to demand caution. Realised vol is declining steadily, compressing into ranges that tend to snap when a catalyst breaks the equilibrium.
Normal volatility regime (42nd percentile) suggests 1.0x normal daily ranges of 250-300 points; current 20-day realized vol of 17.7% implies average daily range of ~330 points; breakouts above 29,700 or breakdowns below 29,150 carry normal sustainability risk without negative gamma amplification; the Options discipline confirms $1.7B positive gamma providing dealer-driven stability that dampens volatility and supports range-bound trading
Week Ahead Outlook
The next major catalyst is ISM Manufacturing PMI for August 2026 (14:00 ET) with estimate 55.3 vs previous 55.6 — high-impact release testing whether manufacturing expansion momentum continues and whether input cost pressures persist, critical for growth/inflation narrative ahead of September FOMC on Tuesday 1 September — a high-impact event that could materially shift the directional picture.
For tech futures, the balance between existing momentum and scheduled risk events sets the stage for the week ahead.
This analysis covers one dimension. Our full weekly report combines six specialist agents into a single actionable briefing with directional bias, key levels, and risk-opportunity matrix.
Start Free — Get the Market of the WeekFree weekly report · No credit card · Upgrade anytime