Russell 2000 Forecast This Week — Outlook, Drivers & Key Levels
This week's Russell 2000 outlook: key drivers, volatility context, risk-opportunity assessment and the week ahead.

Current Market Picture
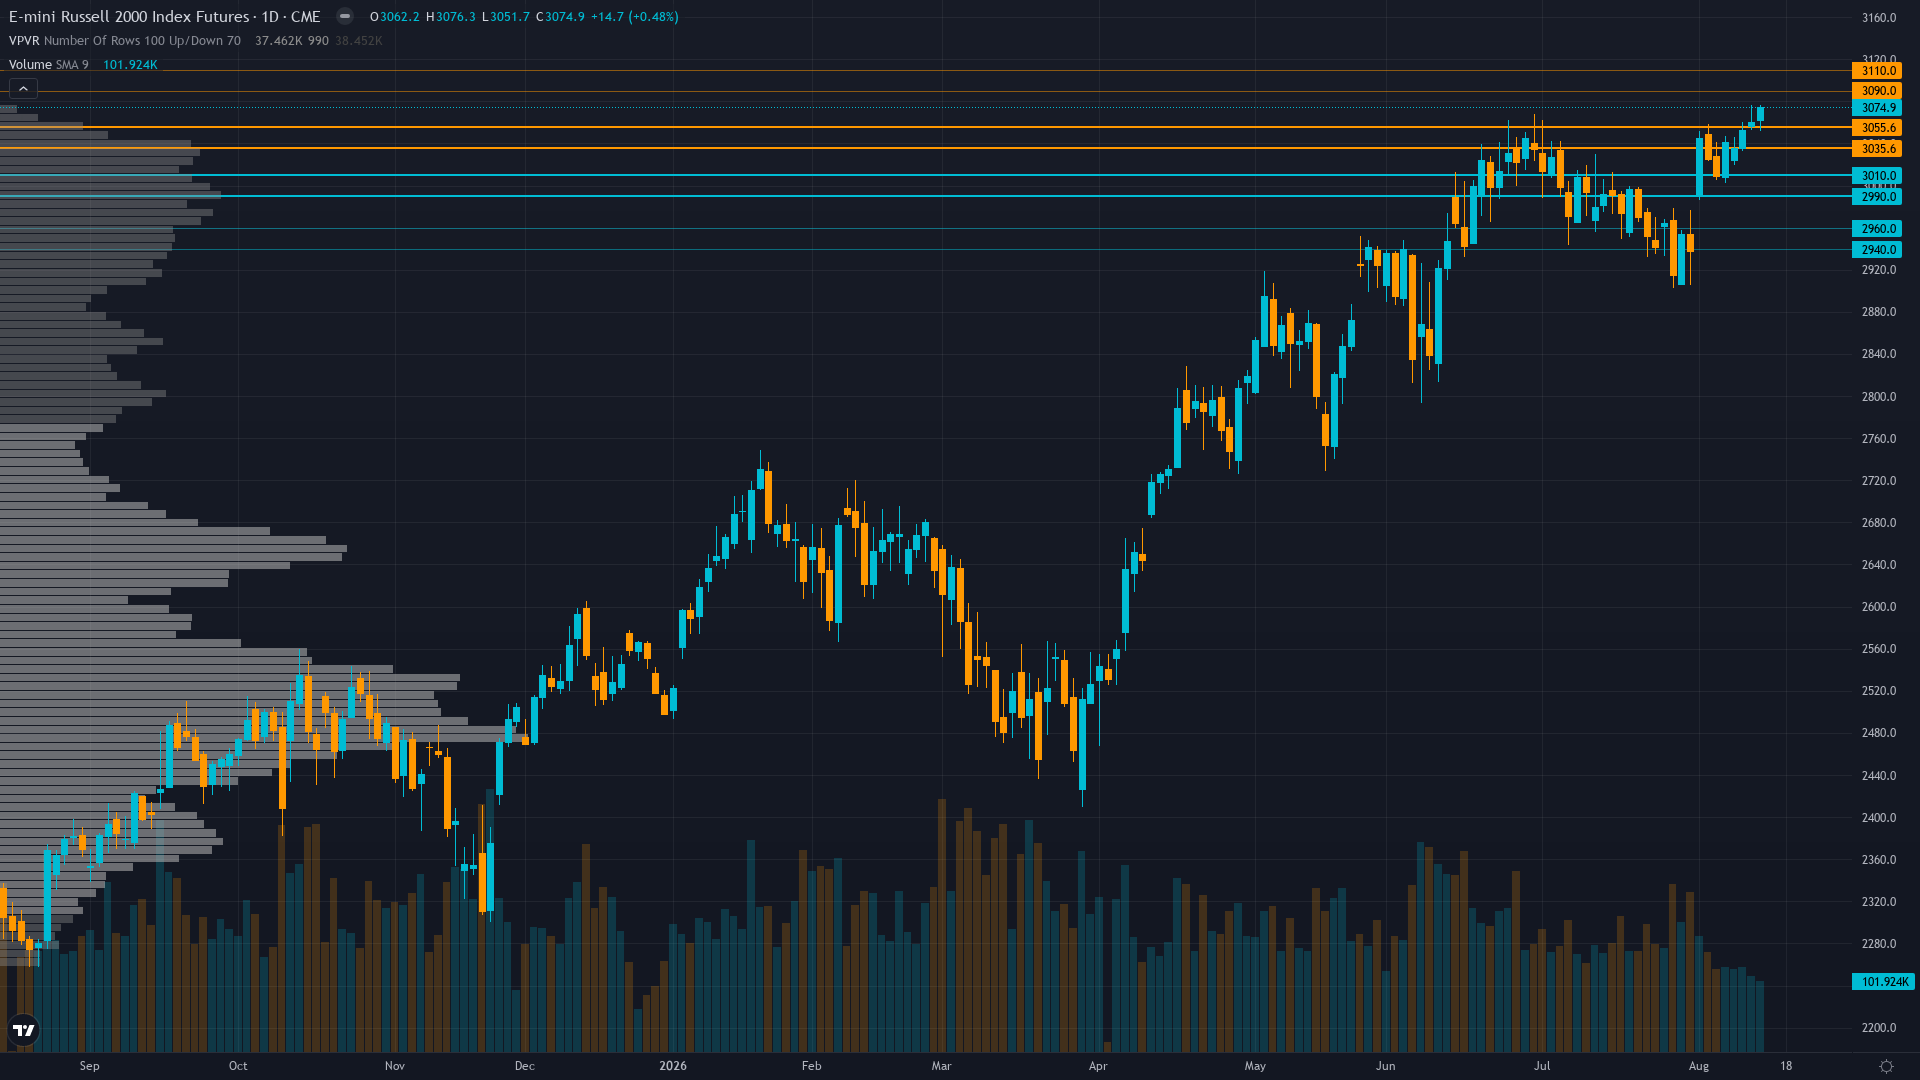
Russell 2000 holds at 3074.9, up a marginal 0.42% as the market grinds forward. Russell 2000 futures is in a breaking out market state, requiring careful assessment of current conditions.
Russell 2000 breaking out to all-time highs with strong momentum, supported by benign CPI, Fed hold expectations, compelling relative valuation vs large caps, and positive earnings revisions, though speculative short positioning at multi-year extremes creates squeeze risk
Key Drivers This Week
Primary driver: RTY breached to a new all-time high at 3,074.90 on August 14, confirming a breakout above the prior July 1 ATH at 3,045.6 and the Aug 12 CPI resistance level, as the benign CPI print (2.27% inflation rate per Aug 14 data) validated the disinflation narrative supporting rate-sensitive small-cap balance sheets carrying floating-rate debt exposure
Secondary factor: Non-commercial net short positioning expanded to -42,304 contracts as of Aug 11 (28.5th percentile of 3-year range, -10.1% of OI), with a further -7,577 contract bearish adjustment week-over-week, creating extreme squeeze potential as speculative shorts continue to add into a market that has now broken cleanly to record highs
Additional influence: Valuation discount narrative supporting rotation — RTY forward P/E of 19.2x represents a 34.5% discount to the Russell 1000's 29.3x (TS2.tech Aug 14), providing fundamental justification for continued institutional rotation from large-caps into small-caps as earnings momentum remains strong with BofA forecasting 17% small-cap growth for 2026
Economic backdrop: RISK-ON regime with VIX at 14.55 well below 20, Fed funds at 3.63% on hold, inflation at 2.27% near target, unemployment improving to 4.1%, but July retail sales declined -0.75% MoM to $660B creating modest consumer spending concern for domestic-focused small-cap revenue exposure
Fundamental assessment: Forward P/E of 19.2x versus Russell 1000's 29.3x (34.5% discount) provides relative value support, Q2 earnings showed margin expansion with BofA forecasting 17% small-cap growth in 2026, net profit margins near 15% record highs per LSEG Aug 13 data, but the 20-year average P/E of 16.2x suggests absolute valuation is stretched
Price Structure
Price at 3,074.90 has broken above the July 1 ATH at 3,045.6 and Aug 12 peak at 3,065.84, now at a fresh all-time high with RSI 60-65 showing healthy momentum without overbought conditions, 200-day MA at ~2,564 providing deep structural support, and the 52-week range position at 100% indicating no overhead resistance
Trend strength sits at 7/10, reflecting a market that has directional bias but hasn't reached extreme conviction.
Volatility Regime
Volatility for RTY futures is at the 62th percentile over 90 days — a normal regime that allows for standard position sizing and conventional trade management. The vol trend is flat, with no meaningful shift across timeframes. Stable vol environments often lull traders before a regime change arrives.
Normal volatility regime at 62nd percentile with inverted term structure requires wider stop placement near 3040 immediate support, expect 40-60 point daily ranges expanding to 60-80 on housing data days, the inverted term structure signals near-term momentum that makes fade plays unreliable until the 3100 resistance area is tested
What History Shows
small-cap futures enters August 2026 without a meaningful seasonal lean (48% win rate). Late summer low volume, high volatility risk.
Risk & Opportunity
Primary risk: Renewed inflation surge (current 2.27% and trending up from 2.24%) forcing Fed hawkish pivot that pressures small-cap floating-rate debt servicing costs and valuations, combined with August-October seasonal headwinds historically producing negative small-cap returns and the massive speculative short position (-42,304 contracts) representing informed money actively fading this rally (Probability: medium)
Primary opportunity: Continued squeeze higher as the ATH breakout at 3,074.90 triggers short covering from the -42,304 contract speculative net short position (28.5th percentile, lowest third of 3-year range) while institutional buyers rotate from expensive large-caps (29.3x P/E) into discounted small-caps (19.2x P/E), with next resistance at the psychological 3,100 round number and measured move targets toward 3,150 (Timeframe: 1-3 weeks through August 18 housing data catalysts)
This week's edge: The market consensus is pricing a benign macro-driven continuation rally justified by valuation discounts and Fed hold expectations, but may be underappreciating the extent of institutional short positioning — non-commercial shorts have expanded to -42,304 contracts at the 28.5th percentile of the 3-year range with -7,577 added in the most recent week alone — representing aggressive short-selling into strength that either signals sophisticated bearish conviction or creates a massive squeeze setup the consensus is not pricing; the desk views this positioning asymmetry as creating tactical upside risk through forced covering rather than fundamental weakness
Looking Forward
On the calendar, July Housing Starts (consensus 1.35M vs prior 1.427M) and Building Permits (consensus 1.37M vs prior 1.374M) — critical for small-cap domestic exposure given healthcare and financial sector concentration of 39.86% in IWM on Tuesday 18 August carries moderate market-moving potential and warrants attention in trade planning.
The week ahead for RTY futures hinges on whether the prevailing breaking out regime can absorb the scheduled catalysts without a regime shift.
This analysis covers one dimension. Our full weekly report combines six specialist agents into a single actionable briefing with directional bias, key levels, and risk-opportunity matrix.
Start Free — Get the Market of the WeekFree weekly report · No credit card · Upgrade anytime



