Russell 2000 Forecast This Week — Outlook, Drivers & Key Levels
This week's Russell 2000 outlook: key drivers, volatility context, risk-opportunity assessment and the week ahead.

This Week's Starting Point
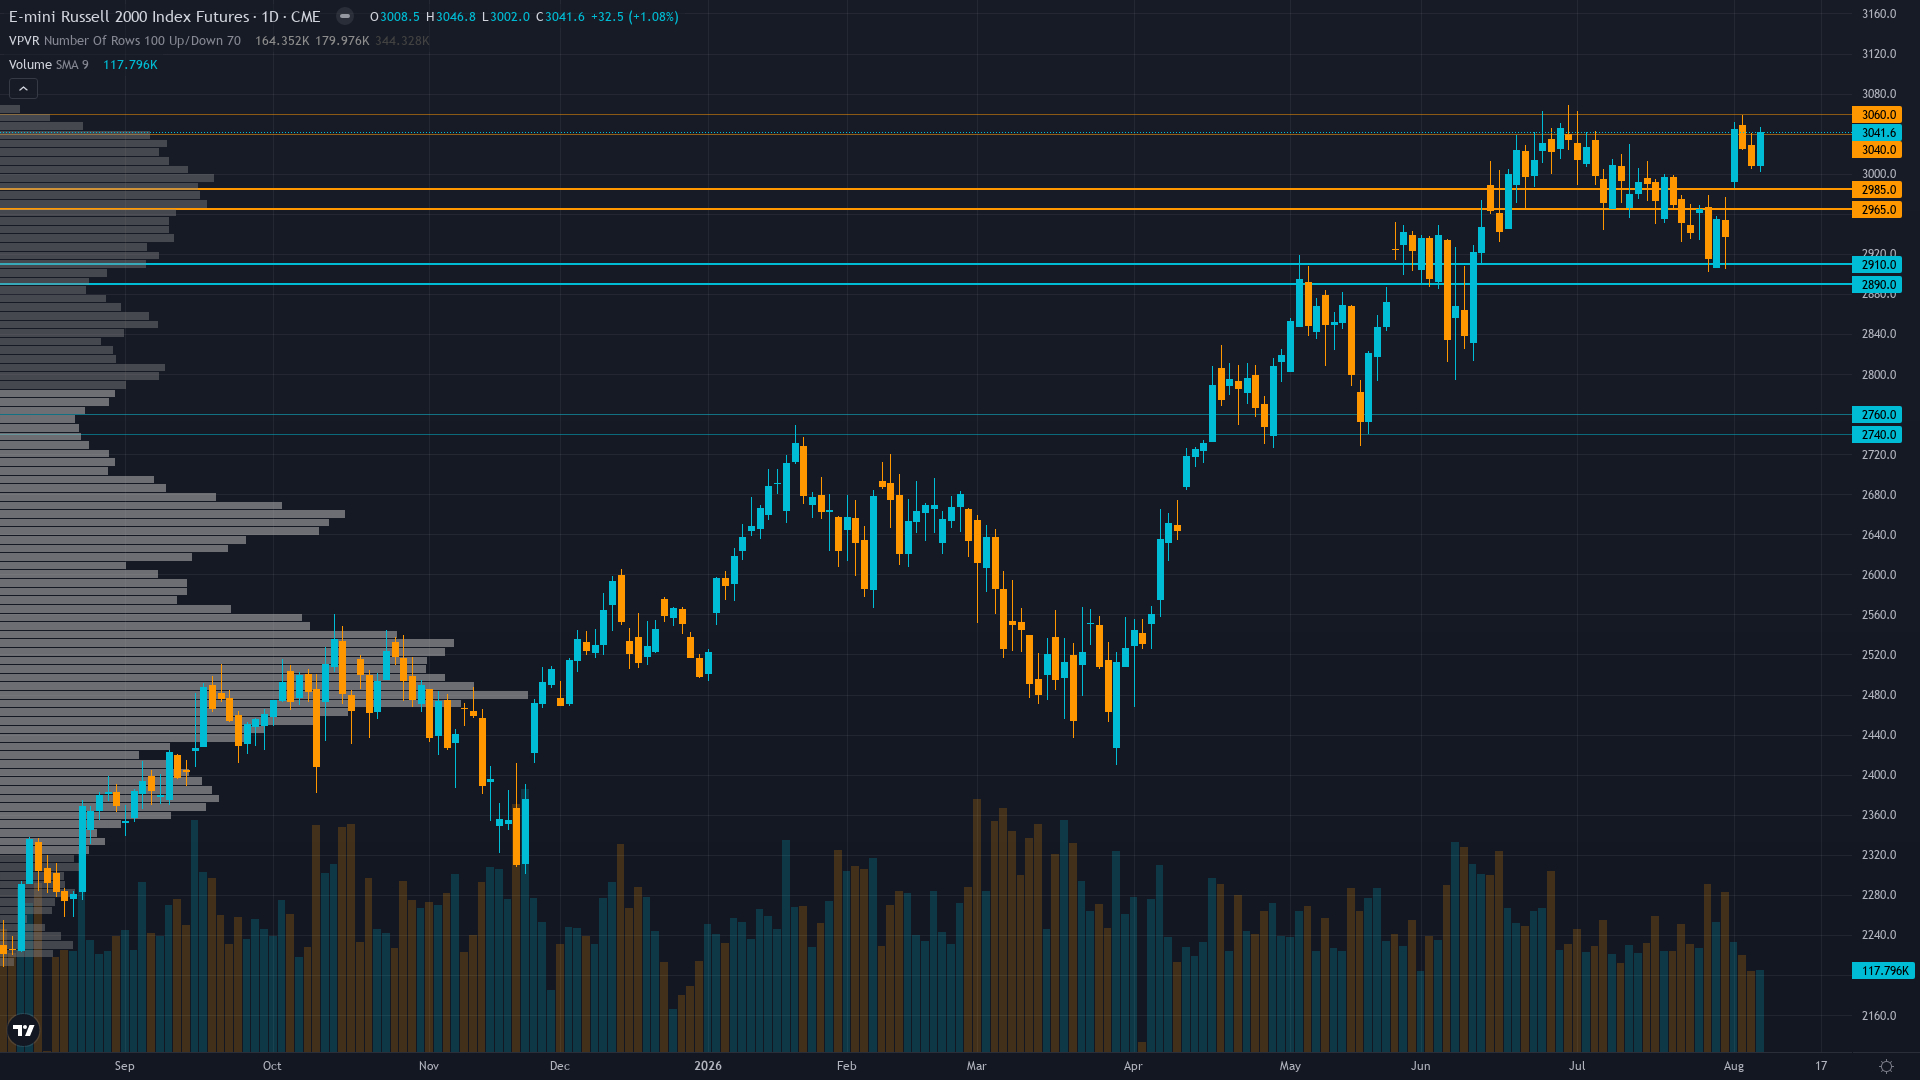
At 3041.6001, Russell 2000 has gained 1.10% over the past session with buying pressure clearly in the driving seat. Price action in Russell 2000 futures has compressed into a consolidation pattern, typically a precursor to a directional breakout.
Small-caps recovering powerfully from July's correction, back within 0.13% of all-time highs, with market positioned for August 12 CPI to confirm disinflation and provide the catalyst for a breakout above 3045.6 resistance
Forces in Play
Primary driver: RTY surged +3.53% last week from 2937 to 3040.4, recovering to within 0.13% of the July 1 all-time high at 3045.6, triggered by declining bond yields (10Y -10bp to 4.65%) and benign VIX at 15.15 as markets positioned for the critical August 12 CPI release forecasting continued disinflation at 3.4% YoY
Secondary factor: August 12 CPI release 3 days away is the dominant near-term catalyst — consensus expects headline CPI easing to 3.4% YoY from 3.5%, with core at 2.5% YoY, and a benign print would validate the disinflation narrative that supports small-cap rate-sensitive balance sheets carrying floating-rate debt exposure
Additional influence: Seasonality remains a structural headwind — CBOE research confirms Russell 2000 historically loses value in August-October on average, and the QuantStrategy analysis shows summer months (May-August) exhibit a significant slowdown and flatter performance for small-caps, creating tension with the current near-ATH price level
Economic backdrop: RISK-ON regime with VIX 15.15 below 20, HY credit spreads at 271bps tightening, Fed funds at 3.63% with no hike expected near-term, unemployment at 4.1% (improving from 4.2%), inflation at 2.25% near target — the macro backdrop supports risk assets but the benign conditions are already priced at near-ATH levels
Fundamental assessment: Forward P/E of 19.1x trades above the 20-year average of 16.2x with the index at 60% above its long-term historical average of 1844.5, but consensus 43% YoY earnings growth forecasts for Russell 2000 constituents provide fundamental justification if delivered; Q2 2026 quality small-caps showed 14.3% sales growth and 20% EBITDA growth per Conestoga Capital
Technical Landscape
Price at 3041.6 trading above both 50-day MA (~2492) and 200-day MA (~2564), consolidating near the July 1 ATH at 3045.6, RSI 60-65 showing healthy momentum without overbought, but the failure to breach ATH resistance on the first attempt creates consolidation risk
Trend strength registers at 6/10, suggesting meaningful but not extreme directional bias.
Risk-Reward Assessment
Primary risk: Failure to breach the July 1 ATH at 3045.6 on the second attempt, combined with August-October seasonal headwinds and speculative short positioning at extremes (-34,727 contracts net short), could trigger profit-taking back toward 3000-2950 support if the August 12 CPI prints hotter than expected, challenging the disinflation narrative that underpins the current risk-on regime (Probability: medium)
Primary opportunity: A benign CPI print on August 12 confirming disinflation trajectory provides the catalyst for a decisive breakout above the July 1 ATH at 3045.6, with the 52-week range position at 99.5% suggesting momentum could extend toward 3100+ as speculative shorts (record -34,727 contracts) face squeeze pressure and institutional buyers rotate from large-caps into undervalued small-caps (Timeframe: 3-5 days through August 12 CPI catalyst)
This week's edge: The market consensus is pricing a benign CPI outcome that validates continued risk-on positioning at near-ATH levels, but may be underappreciating the combination of (a) August-October seasonal headwinds that historically produce negative small-cap returns, (b) the aggressive speculative short positioning (-18,458 contract increase in one week) suggesting informed money is selling into this strength, and (c) the elevated forward P/E of 19.1x (60% above long-term average of 1844.5) that creates acute delivery risk if Q3 earnings disappoint the 43% growth bar — the desk sees a tactical tension between powerful short-term momentum and structural vulnerabilities that the consensus is not pricing
Risk Environment
With vol at the 62th percentile over 90 days, RTY futures is in a measured regime that doesn't require unusual adjustments. Volatility is stable, with realised vol holding steady across timeframes. This equilibrium can persist but eventually resolves into expansion or contraction.
Normal-to-moderate volatility regime at 62nd percentile with inverted term structure requires wider stop placement near 3000 support, expect 40-60 point daily ranges expanding to 60-80 on August 12 CPI day, the inverted term structure signals near-term catalyst risk that makes breakout plays unreliable until CPI provides directional clarity
Seasonal Context
Historical seasonal patterns for small-cap futures offer no strong directional signal in August 2026 (48% win rate). Late summer low volume, high volatility risk.
Week Ahead Outlook
The next major catalyst is July CPI release — headline consensus 3.4% YoY (prior 3.5%), core 2.5% YoY (prior 2.6%); a benign print supports the Fed hold narrative and provides relief for rate-sensitive small-caps; an upside surprise would challenge the disinflation thesis at a vulnerable near-ATH price point on Wednesday 12 August — a high-impact event that could materially shift the directional picture.
For Russell 2000, the balance between existing momentum and scheduled risk events sets the stage for the week ahead.
This analysis covers one dimension. Our full weekly report combines six specialist agents into a single actionable briefing with directional bias, key levels, and risk-opportunity matrix.
Start Free — Get the Market of the WeekFree weekly report · No credit card · Upgrade anytime



