Russell 2000 Forecast This Week — Outlook, Drivers & Key Levels
This week's Russell 2000 outlook: key drivers, volatility context, risk-opportunity assessment and the week ahead.

Current Market Picture
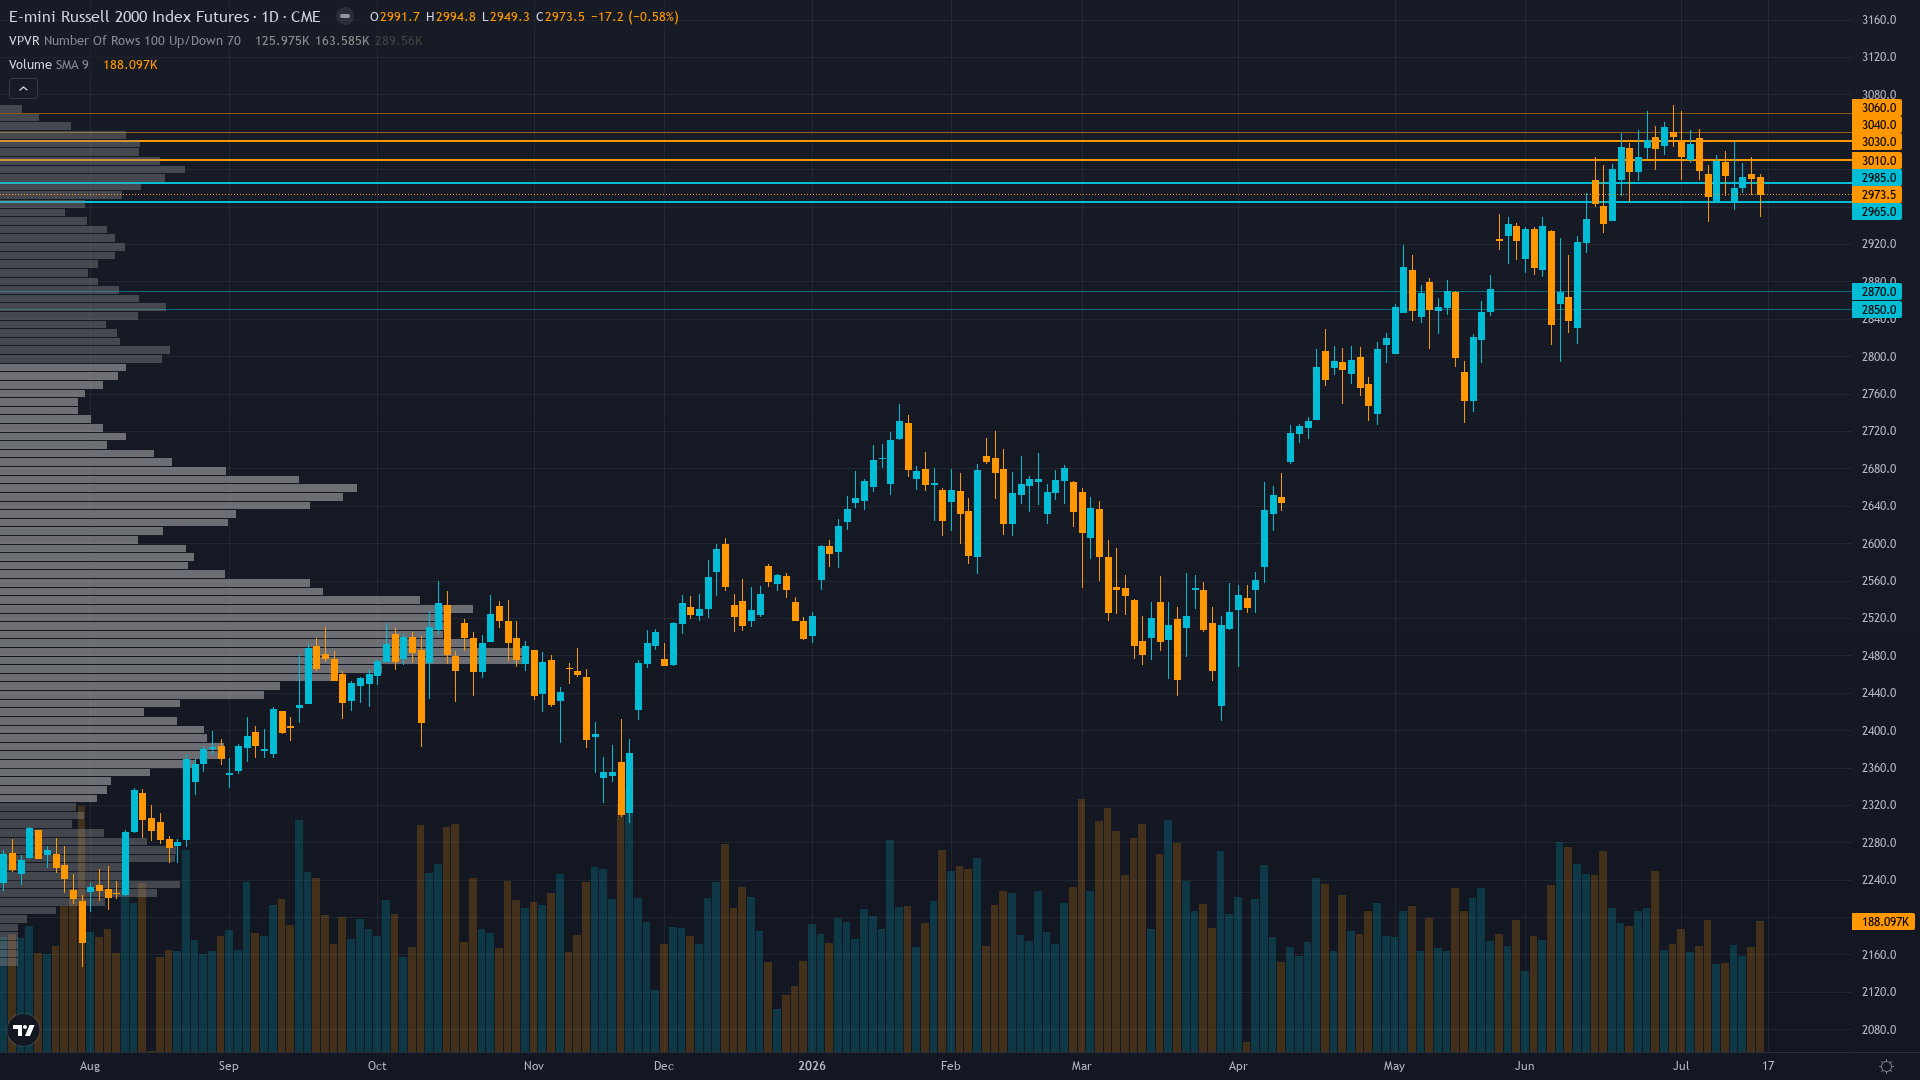
Russell 2000 holds at 2986, up a marginal 0.53% as the market grinds forward. The market in Russell 2000 futures is coiling, with narrowing price ranges suggesting stored energy that will eventually release.
Small-caps consolidating 2% below July 1 all-time high at 3049.9 with market celebrating record H1 2026 performance (+22% best since 1991) and maintaining constructive outlook on Q2 earnings validation beginning mid-July, positioned for July FOMC to provide policy clarity
Risk & Opportunity
Primary risk: Continued labor market deterioration validating June NFP weakness triggers Fed policy error recognition or July FOMC maintains hawkish stance despite weakening data, forcing 5-8% correction toward 2750-2800 support as credit-sensitive RTY constituents carrying 40% floating-rate debt reprice tightening financial conditions into weakening domestic growth backdrop (Probability: high)
Primary opportunity: July 28-29 FOMC delivers dovish pivot explicitly acknowledging June employment collapse and removes hike language from forward guidance, triggering relief rally targeting retest of 3020-3050 resistance as rate-sensitive small-caps benefit from easing financial conditions expectations offsetting near-term growth concerns (Timeframe: 9 days through July 28-29 FOMC meeting providing binary catalyst resolution)
This week's edge: Market consensus celebrating July 1 ATH and record H1 performance may be severely underpricing significance of catastrophic June NFP miss (17 days old) creating acute policy-data mismatch with Fed's hawkish posture—while consensus focuses on prior momentum narrative and elevated earnings expectations (38-43% growth bar), desk recognizes acute vulnerability for credit-sensitive small-caps where 40% carry floating-rate debt into environment where Fed shows 22% July hike probability despite domestic employment collapse, with technical breadth deterioration and VIX expansion signaling late repricing beginning that consensus has not yet fully incorporated
What's Driving Price
Primary driver: June NFP catastrophe (+57k vs 110k consensus, household employment -507k) released July 2 creates acute policy-data mismatch with Fed Chair Warsh's June 17 hawkish pivot showing 9 of 18 officials expecting 2026 rate hike, uniquely problematic for credit-sensitive small-caps carrying 40% floating-rate debt exposure
Secondary factor: Technical deterioration confirmed with RTY trading at 2986 down 2.1% from July 1 all-time high of 3049.9, breadth collapsed to 41.3% advancing vs 57.7% declining as of July 9, RSI 33.7 oversold without bullish divergence creating failed breakout structure validating bearish lean
Additional influence: VIX spike from 15.67 to 18.77 between July 16-17 signals rising volatility despite equity put/call remaining complacent at 0.73, creating dangerous divergence where market positioning has not yet priced technical deterioration and employment weakness catalyst
Economic backdrop: TRANSITIONAL regime moving toward RISK-OFF: June NFP catastrophic miss at +57k vs 110k consensus with household employment -507k contradicts Fed Chair Warsh's June 17 hawkish pivot showing 22% July hike probability per Polymarket, creating policy-data disconnect acutely problematic for rate-sensitive small-caps where Fed maintains higher-for-longer stance into weakening domestic employment backdrop
Fundamental assessment: Q2 2026 earnings season beginning mid-July provides validation opportunity for elevated 38-43% growth expectations, but forward P/E at 25.39x versus 13.62-17.34x historical range creates acute vulnerability if results disappoint elevated bar, with 40% of RTY constituents unprofitable and 40% carrying floating-rate debt exposing credit sensitivity to hawkish Fed stance
Chart Assessment
Trading at 2986, down 2.1% from July 1 ATH at 3049.9 in failed breakout structure, RSI 33.7 oversold but no bullish divergence, breadth negative at 41.3% advancing, momentum deteriorating with MACD -11.97 confirming bearish pressure despite consolidation near record levels
With trend strength at 4/10, the directional signal is present but far from decisive.
Volatility Context
At the 48th percentile, RTY futures volatility sits in a normal range, neither compressed enough to signal a breakout nor elevated enough to demand caution. Realised vol is holding its current level, suggesting the market has found a temporary equilibrium in its risk pricing.
Normal volatility regime at 48th percentile supports standard risk management though recent VIX spike suggests transition toward elevated regime, expect 40-60 point daily ranges expanding toward 60-80 if breakdown accelerates, compressed 30-point intraday range today suggests coiling action ahead of July FOMC catalyst providing directional clarity with volatility likely expanding meaningfully into and through the July 28-29 meeting
Seasonal Patterns
Seasonality is a non-factor for small-cap futures this month, with a 50% historical win rate offering no edge. Mid-year earnings season volatility.
Looking Forward
All eyes turn to Federal Reserve FOMC Meeting July 28-29 with statement July 29 critical for resolving policy-data contradiction between catastrophic June NFP miss and current 22% July hike probability, forward guidance decisive for credit-sensitive small-cap trajectory where rate expectations directly impact refinancing costs and floating-rate debt servicing on Tuesday 28 July, which carries enough weight to force a decisive directional move.
The week ahead for RTY futures hinges on whether the prevailing consolidating regime can absorb the scheduled catalysts without a regime shift.
This analysis covers one dimension. Our full weekly report combines six specialist agents into a single actionable briefing with directional bias, key levels, and risk-opportunity matrix.
Start Free — Get the Market of the WeekFree weekly report · No credit card · Upgrade anytime



